XB-IMG-122783
Xenbase Image ID: 122783

|
|
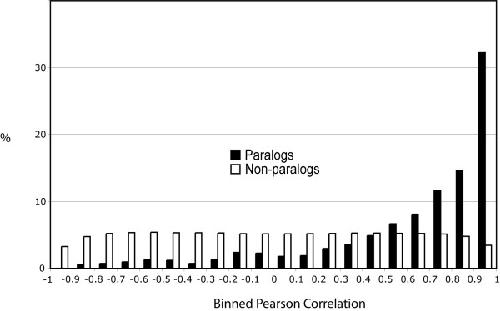
Figure 4. Binned expression profile correlations between 841 pairs of paralogs over five developmental stages or adult tissue types in the medium specificity analysis. The proportion of Pearson correlation coefficients between non-paralogous expression profiles (white bars) and between paralogous expression profiles (black bars). Ninety percent of the non-paralogous expression profiles have a Pearson correlation coefficient that is greater than -0.861 but less than 0.865. The Pearson correlation coefficients of 62% of the paralogous expression profiles are less than 0.865, and 0.3% of them are less than -0.861. Image published in: Chain FJ et al. (2008) Copyright ©2008 Chain et al; licensee BioMed Central Ltd. Creative Commons Attribution license Larger Image Printer Friendly View |
