XB-IMG-124445
Xenbase Image ID: 124445
|
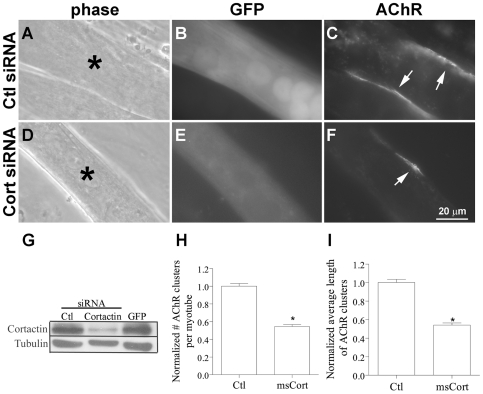
Figure 6. Inhibition of agrin-induced AChR clustering by down-regulation of cortactin expression in myotubes.C2 myotubes generated from myoblasts transfected with control siRNAs (A-C) or a pool of siRNAs directed against mouse cortactin (D-F) (both mixed with a cDNA encoding GFP) were incubated overnight in differentiation medium containing agrin before labeling with R-BTX. Transfected myotubes (A, D; asterisks) were identified by green fluorescence (B, E), and the AChR clusters present on their surface (C, F; arrows) were counted and the lengths of these clusters were measured. G. To demonstrate that siRNAs against cortactin knocked down cortactin expression, in each experiment extracts were prepared from myotubes generated from myoblasts transfected in parallel and maintained under conditions identical to those used for examining agrin-induced AChR clustering. Extracts of cells transfected with GFP cDNA plus control (p120ctn) siRNA (Ctl; left lane), cortactin siRNA (middle lane) or GFP cDNA alone (right lane) were immuno-blotted with antibodies against cortactin (upper blot) or tubulin (lower blot). The cortactin siRNA suppressed the expression of cortactin without affecting unrelated proteins (such as tubulin, which is also shown here to demonstrate equal protein loading), and cortactin's expression was not affected by control siRNAs or by transfection procedures (where only GFP cDNA was used). From four transfection experiments AChR cluster data from control (Ctl) and mouse cortactin (msCort) siRNA-transfected myotubes were pooled and normalized relative to those obtained from cells transfected with the control siRNA. These results showed that agrin-induced AChR cluster numbers (H) and lengths (I) were significantly lower in myotubes expressing reduced levels of endogenous cortactin compared to those expressing normal levels of cortactin. Mean and SEM values are shown, *P<0.05. Image published in: Madhavan R et al. (2009) Madhavan et al. This image is reproduced with permission of the journal and the copyright holder. This is an open-access article distributed under the terms of the Creative Commons Attribution license Larger Image Printer Friendly View |