XB-IMG-124583
Xenbase Image ID: 124583
|
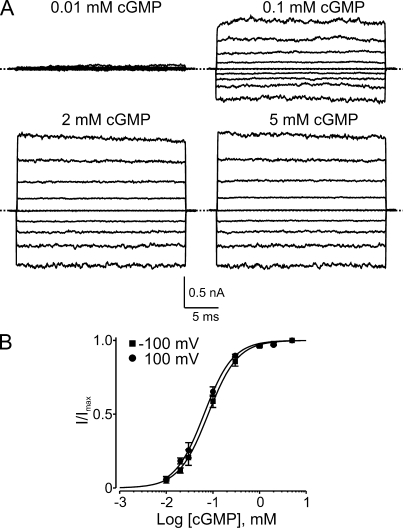
Figure 1. cGMP activation of CNGA1 channels. (A) Macroscopic current traces recorded in symmetric 130 mM Na+ from an inside-out patch containing CNGA1 channels in the presence of the indicated concentrations of intracellular cGMP. Currents were elicited by stepping from the 0-mV holding potential to voltages between −200 and 200 mV in 50-mV increments. Currents in the absence of cGMP were used as templates for subsequent offline background current corrections. Dotted lines indicate 0 current levels. (B) Fraction of maximal current (I/Imax; mean ± SEM; n = 3–7) plotted against cGMP concentration for −100 mV (squares) and 100 mV (circles). Solid curves are Hill equation fits yielding EC50 = 79 ± 1 µM and h = 1.37 ± 0.03 at −100 mV, and EC50 = 64 ± 2 µM and h = 1.39 ± 0.05 at 100 mV. Image published in: Martínez-François JR and Lu Z (2010) © 2010 Martínez-François and Lu. This image is reproduced with permission of the journal and the copyright holder. This is an open-access article distributed under the terms of the Creative Commons Attribution-NonCommercial-ShareAlike license Larger Image Printer Friendly View |