XB-IMG-125728
Xenbase Image ID: 125728
|
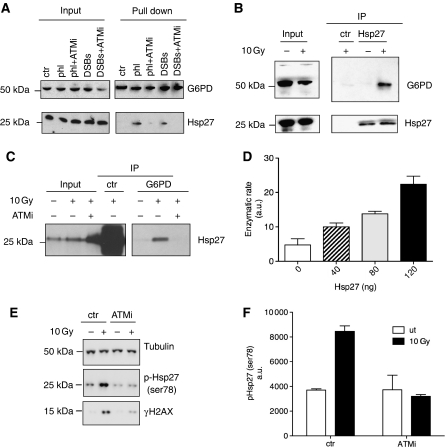
Figure 2. HSP27 binding to G6PD. (A) Xenopus egg extract was left untreated (ctr) or treated for 15 min with 20 ng/μl DSBs (DSBs) in the presence or absence of 10 μM ATMi (ATMi) or supplemented with 3000 nuclei per microliter treated with 10 μM phleomycin (phl). Hundred microliters of extract were then diluted in PBS and incubated with 2′-5′-ADP-sepharose beads. The proteins bound to the beads were eluted in Laemmli buffer and loaded on a 4–12% SDS–PAGE gel, transferred onto nitrocellulose filter and analysed by western blot with anti-G6PD (upper panel) and anti-HSP27 (bottom panel) antibodies. (B) AG02603 fibroblast cells were left untreated or irradiated with 10 Gy. After 1 h, cells were collected and the proteins were extracted. The whole cell lysates were incubated with control (ctr) or anti-HSP27 antibodies. The samples were then analysed by western blot with anti-G6PD (upper panel) and anti-HSP27 (bottom panel) antibodies. (C) AG02603 cells were treated with 0.1% DMSO or 10 μM ATMi before being irradiated with 10 Gy or left untreated. G6PD was immunoprecipitated with specific anti-G6PD antibodies and the samples were analysed by western blot with anti-HSP27 antibodies. Non-immune serum was used as control (ctr). (D) In vitro G6PD activity assay: 300 ng of recombinant G6PD was incubated for 10 min at 30°C with the indicated amount of recombinant Hsp27. G6PD activity was then assessed. The histogram represents average enzymatic activities relative to untreated control (0). Experiment was repeated three times. Error bars represent s.d. (E) Human fibroblasts were exposed to 10 Gy of IR in the presence or absence of 10 μM ATMi. Total cell lysates were loaded on SDS–PAGE and then analysed by western blot with anti-phospho-Hsp27 (ser78), anti-tubulin and anti-γH2AX. (F) The histogram represents the average of three independent experiments in which Hsp27 phosphorylation was determined. Error bars represent s.d. Image published in: Cosentino C et al. (2011) Copyright © 2011, European Molecular Biology Organization. This image is reproduced with permission of the journal and the copyright holder. This is an open-access article distributed under the terms of the Creative Commons Attribution-NonCommercial-ShareAlike license Larger Image Printer Friendly View |