XB-IMG-127221
Xenbase Image ID: 127221
|
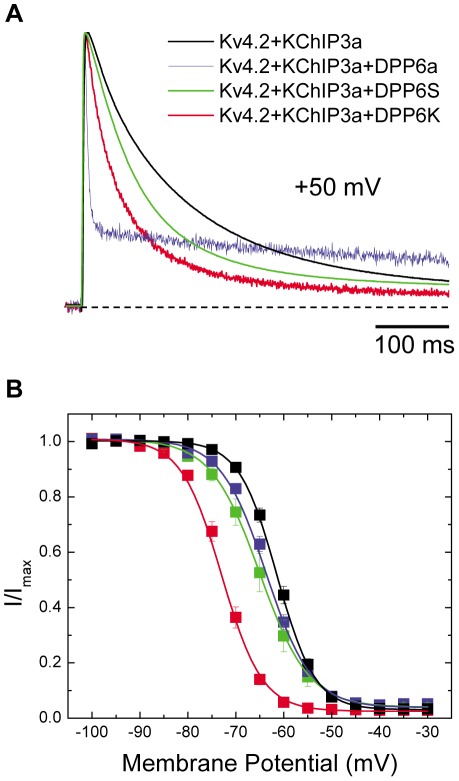
Figure 2. DPP6K dramatically accelerates inactivation kinetics and leftward shifts steady-state inactivation curve.Xenopus oocytes were injected with cRNAs encoding Kv4.2 and KChIP3a along with either DPP6a, DPP6S, or DPP6K. Transient currents were recorded using two-electrode voltage clamp. (A) Representative normalized current traces generated by voltage steps to +50 mV from a holding potential of −100 mV for 1 sec. Only the first 500 ms are shown. (B) Voltage dependence of steady-state inactivation for the various channel complexes. The steady-state inactivation protocol consisted of a 10-sec prepulse at the indicated potentials and a 250-ms test pulse to +50 mV, with an inter-episode interval of 5 secs. The fraction of available current (I/Imax) was plotted against the prepulse membrane potential. Data are shown as mean ± SEM, and the lines represent fits using Boltzmann functions. Image published in: Jerng HH and Pfaffinger PJ (2012) Jerng, Pfaffinger. This image is reproduced with permission of the journal and the copyright holder. This is an open-access article distributed under the terms of the Creative Commons Attribution license Larger Image Printer Friendly View |