XB-IMG-127401
Xenbase Image ID: 127401
|
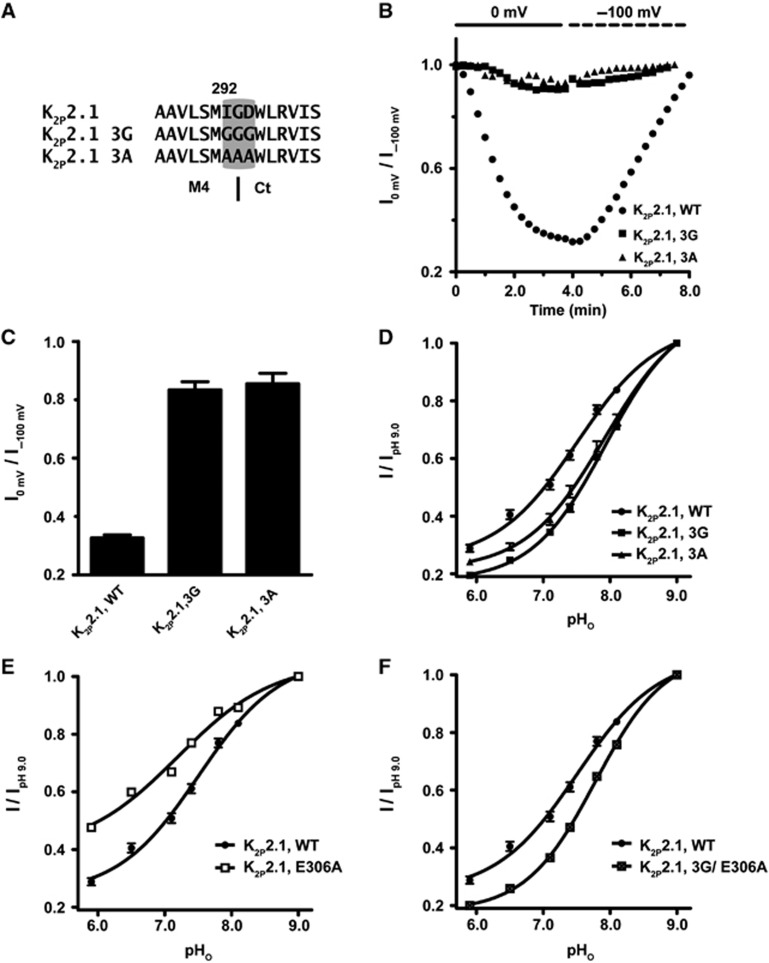
Figure 4. M4–Ct junction is critical for cross-talk between Ct and the C-type gate. (A) Amino-acid sequence of the M4–Ct junction region of K2P2.1 (TREK-1) showing the location of the 3G and 3A mutations. Dashed line indicates a predicted boundary between M4 and Ct. (B) Exemplar time resolution of channel activity from a representative cell in response to fluctuating EM in 2 mM [K+]o pHo 7.4. Each point represents channel activity from the ramp curves at 0 mV. Data presented as fraction relative to activity after initial stabilization at −100 mV. (C) Quantification of maximal K2P2.1 (TREK-1) inhibition by prolonged incubation at 0 mV (mean±s.e., n⩾6, N⩾2). (D–F) Normalized responses of the indicated channels to pHo changes in 2 mM [K+]o. Currents were elicited by a voltage ramp from −150 to +50 mV, from a holding potential of −80 mV. Data (mean±s.e., n⩾6, N⩾2) was taken at 0 mV, normalized to activity at pH 9.0 and fitted to the Hill equation. Image published in: Bagriantsev SN et al. (2012) Copyright © 2012, European Molecular Biology Organization. This image is reproduced with permission of the journal and the copyright holder. This is an open-access article distributed under the terms of the Creative Commons Attribution-NonCommercial-ShareAlike license Larger Image Printer Friendly View |