XB-IMG-130648
Xenbase Image ID: 130648

|
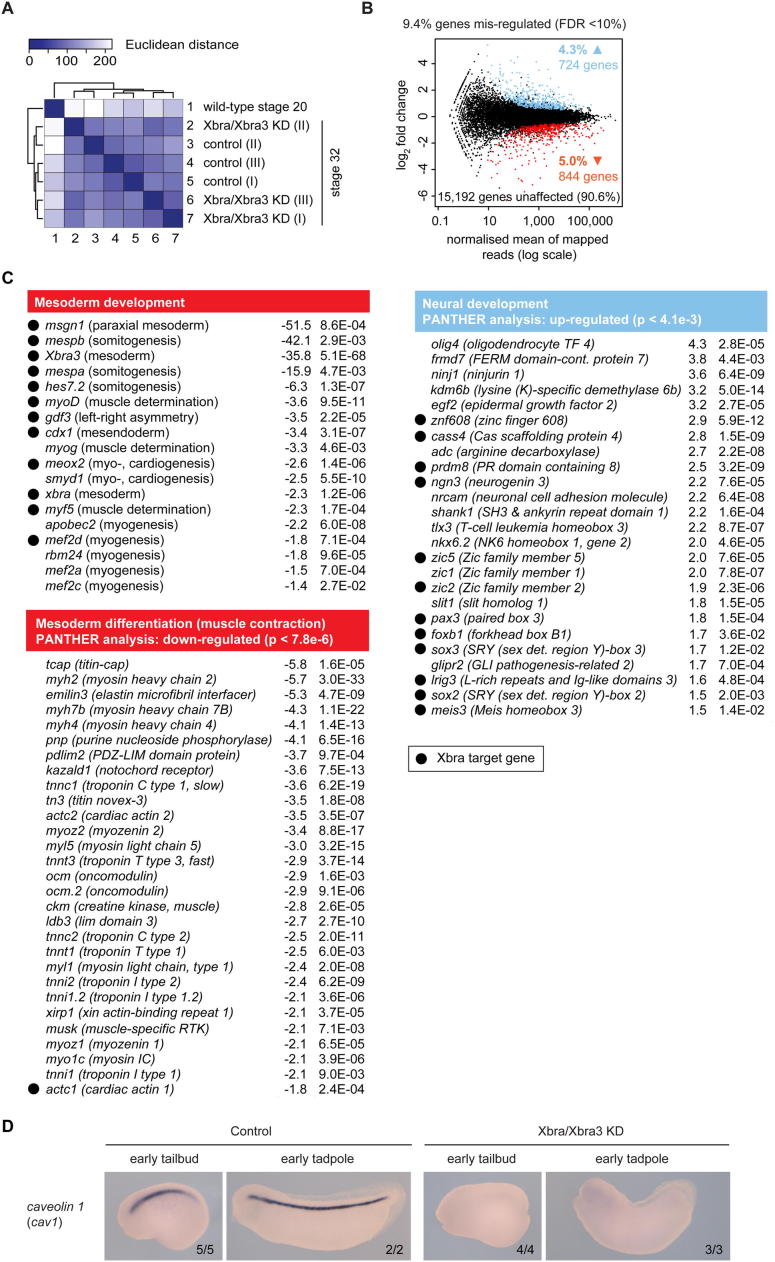
Figure S4. Transcriptome Analysis of Xbra/Xbra3-Depleted Early Tadpoles Confirms Cell Identity Shift from Mesoderm to Neurectoderm, Related to Figure 2(A) Hierarchically clustered heat map of transcriptional profiles (RNA-Seq) of control and Xbra/Xbra3 KD embryos at early tadpole stage (stage 32) in biological triplicates based on Euclidean distances. Wild-type embryos (stage 20) were used as an outlier. We note considerable biological variation among biological replicates (I and III versus II) causing clustering irrespective of KD condition.(B) Plot of averaged read count between the control and KD condition versus the log2 fold change between Xbra/Xbra3 KD and control embryos. Under the condition of 10% FDR, 724 genes were declared as upregulated (4.3%, blue dots), 844 genes as downregulated (5.0%, red dots) and 15,192 genes as not significantly differentially expressed (90.6%).(C) Statistical significance of gene mis-regulation (â¥1.5-fold, FDR < 10%) specific to mesoderm (downregulated; p < 7.8e-6) and neurectoderm (upregulated; p < 4.1e-3) was based on the Mann-Whitney U test using the PANTHER classification system (Mi et al., 2007). Early embryonic tissue-specific data sets were manually curated. Tables list mis-regulated genes (including fold changes and p-values adjusted with the Benjamini-Hochberg procedure) mainly associated with the biological process of mesoderm development (gene abbreviations are followed by the gene-associated mesodermal process in parentheses), muscle contraction (PANTHER GO term) and neural development (PANTHER GO term). A minus preceding the floating-point number of the fold change indicates a downregulation. Genes marked with a dot were associated with Xbra binding.(D) WMISH for caveolin-1 (cav1) at early tailbud and early tadpole stage illustrates the loss of notochord development upon Xbra/Xbra3 KD. Statistics in bottom right corner indicates the number of embryos observed with the depicted WMISH pattern versus the number of embryos analyzed in total. Image published in: Gentsch GE et al. (2013) © 2013 The Authors. Creative Commons Attribution license Larger Image Printer Friendly View |
