XB-IMG-130649
Xenbase Image ID: 130649
|
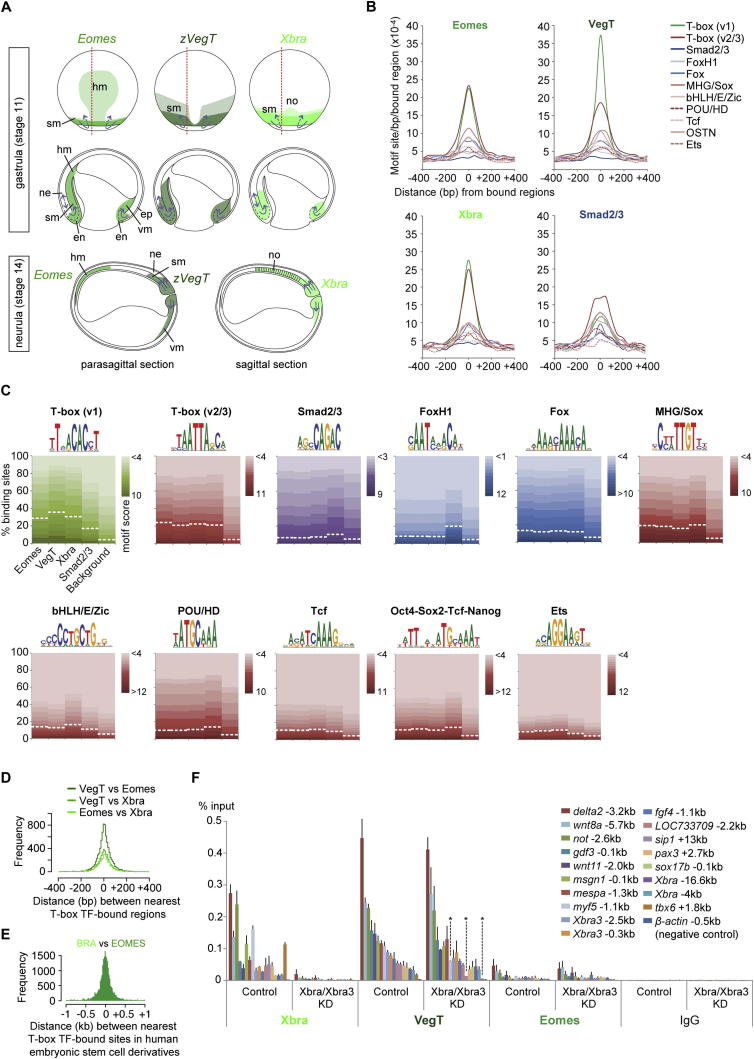
Figure S5. Expression Patterns and Binding Characteristics of Eomes, VegT, and Xbra in Xenopus Embryos during Gastrulation, Related to Figure 4(A) Expression pattern scheme of Eomes, VegT and Xbra at gastrula (dorsal view and parasagittal section as indicated with ventral side to the right) and early neurula (sagittal and parasagittal section with posterior end to the right) based on our own WMISH and WMIHC (not shown) and published expression data (Fukuda et al., 2010; Horb and Thomsen, 1997; Ryan et al., 1996; Smith et al., 1991; Stennard et al., 1996, 1999; Zhang and King, 1996). At early gastrula stage, Eomes and VegT transcripts are also found in vegetal endoderm (omitted in figure). Blue arrows, morphogenetic movements (Stern, 2004). Abbreviations: en, endoderm; ep, epidermis; hm, head mesoderm; ne, neurectoderm; no, notochord; sm, somitic mesoderm; vm, ventral mesoderm.(B) Density maps of enriched motifs found in genomic regions bound by Eomes, VegT, Xbra and Smad2/3 in vivo show that their bindings correlate with highest enrichment for the T-box TF motif.(C) Motif enrichments for several DNA-binding factors were calculated from genome-wide binding maps for Eomes, VegT, Xbra (this study) and Smad2/3 (Yoon et al., 2011) using Homer Perl scripts (Heinz et al., 2010) and normalized to 5% background (see dashed line in diagrams for each motif). The underlying motif score was used to create the density maps (B). We note that the consensus motif of FoxH1 known to interact with Smad2/3 (Chen et al., 1997; Watanabe and Whitman, 1999; Zhou et al., 1998) is as enriched at Smad2/3 binding sites as T-box or MHG/Sox motifs. The same MHG/Sox motif is also found at T-box TF binding sites.(D) Histograms based on pairwise (Xbra versus Eomes, Xbra versus VegT and Eomes versus VegT) calculations of distances between the nearest peaks (FDR ⤠1%) of two different T-box TFs in frog gastrula embryos.(E) Histograms based on pairwise calculations of shortest distances between BRACHYURY and EOMES binding positions in human mesoderm and definitive endoderm (Teo et al., 2011) derived from embryonic stem cells in vitro.(F) ChIP-qPCR for Xbra, VegT and Eomes on control and Xbra/Xbra3-depleted late gastrula embryos (stage 12). DNA occupancy plotted as percentage of DNA input. Error bars, s.d. of biological duplicates. Two-tailed Studentâs t test indicates significant reduction (â) of VegT recruitment to genomic regions 1.1kb upstream of myf5 (p = 0.11), 1.8kb upstream of tbx6 (p = 0.11) and 13kb downstream of sip1 (p = 0.07) upon Xbra/Xbra3 KD. All other VegT and Eomes binding events seem not to be or non-significantly affected by the KD of Xbra/Xbra3 at stage 12. Image published in: Gentsch GE et al. (2013) © 2013 The Authors. Creative Commons Attribution license Larger Image Printer Friendly View |