XB-IMG-130679
Xenbase Image ID: 130679
|
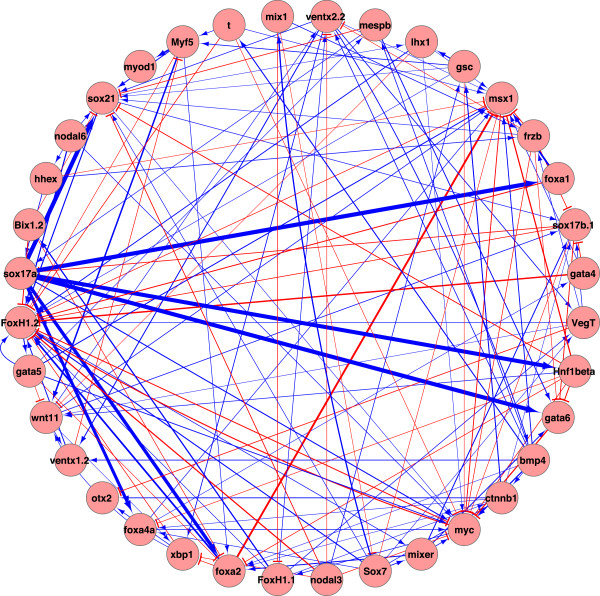
Figure 6. Inferred network from the linear Markov model. Positive interactions are shown in blue and negative interactions are shown in red. The strength of connections is indicated via the thickness of lines connecting the genes. The interactions vary from −1.1317 to 2.5607 and a threshold 0.2 is applied, i.e., all the edges with the weights smaller than 0.2 are discarded. Image published in: Zheng Z et al. (2014) Copyright © 2014 Zheng et al. This image is reproduced with permission of the journal and the copyright holder. This is an open-access article distributed under the terms of the Creative Commons Attribution license Larger Image Printer Friendly View |