XB-IMG-130872
Xenbase Image ID: 130872
|
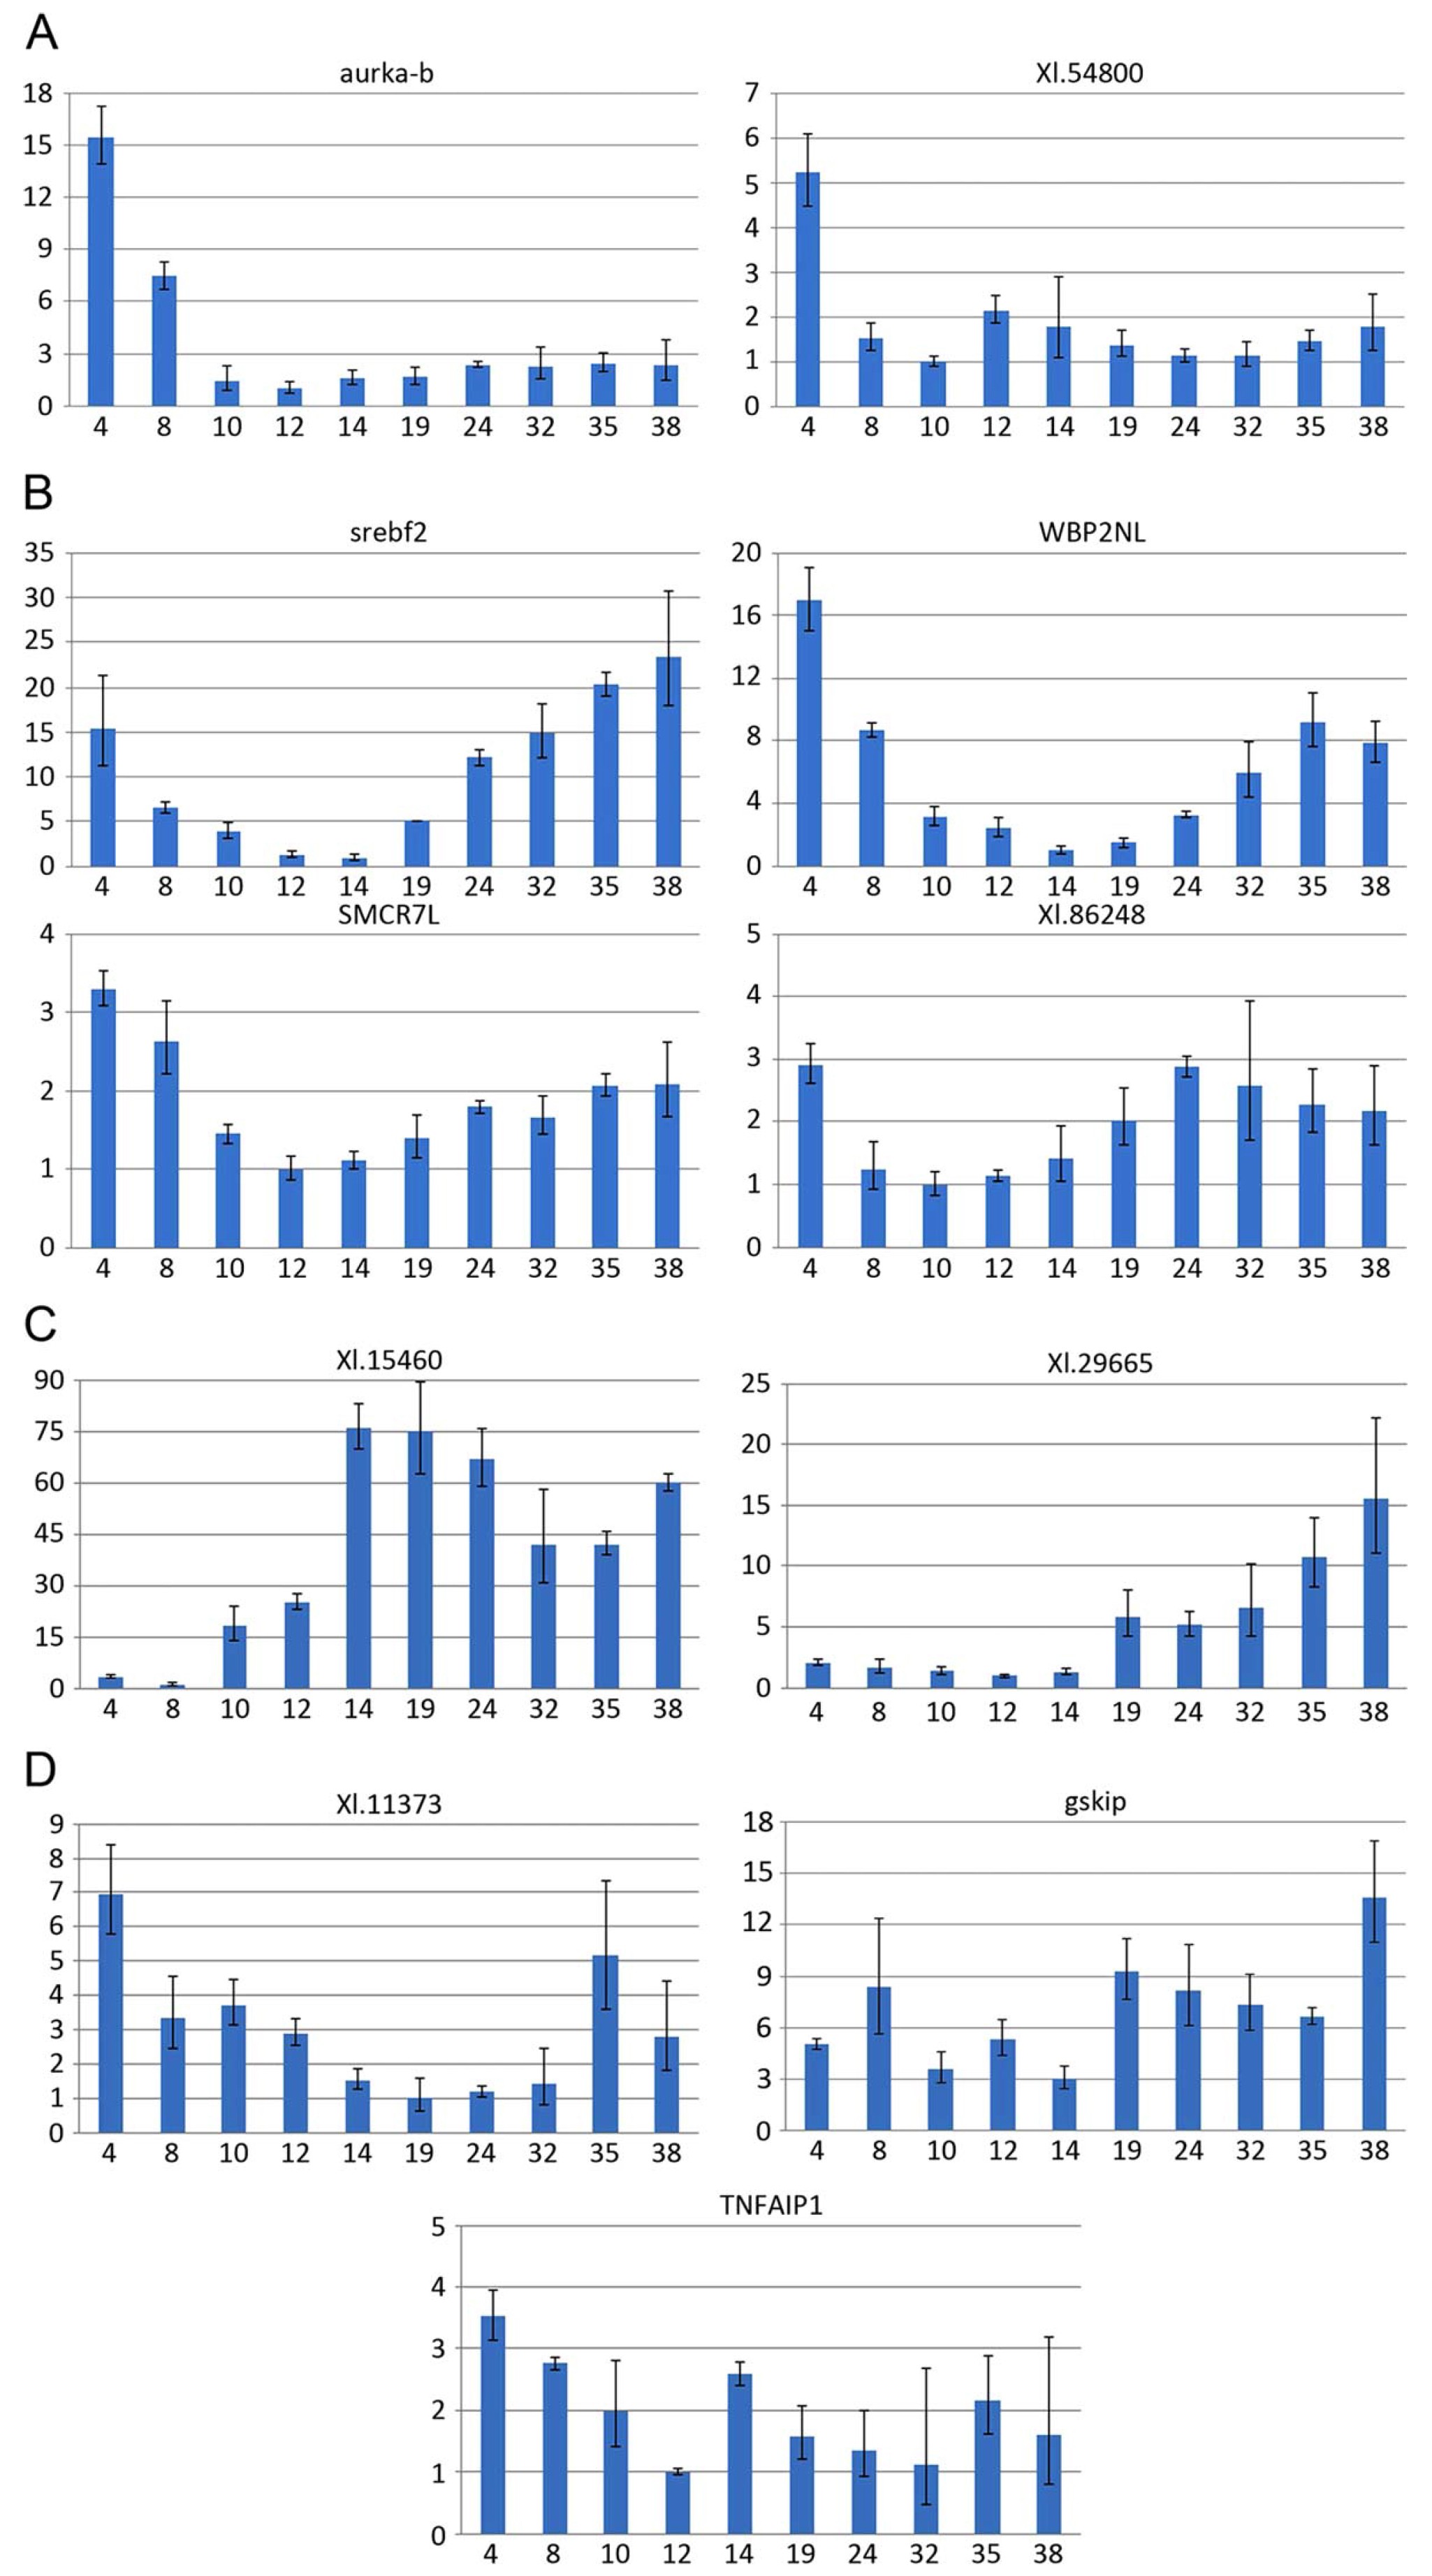
Fig. 5. Developmental time course of expression in whole embryos as detected by qRT-PCR. A: Two genes (aurka-b, Xl.54800) are most highly
expressed during the maternal phase of development (st 4), gradually decrease during the onset of zygotic transcription (st 8–10), and remain at
relatively low levels during the remaining stages analyzed. B: Four genes (srebf2, WBP2NL, SMCR7L, Xl.86248) are highly expressed during the
maternal phase of development and gradually decrease during the onset of zygotic transcription, but rebound to higher expression levels at neurulation
(st 19) through larval (st 35–38) stages. C: Two genes (Xl.15460, Xl.29665) are expressed at the lowest level maternally and at relatively high
levels after neural plate stages. D: Three genes (Xl.11373, TNFAIP1, gskip) are strongly expressed maternally, with decreasing expression at early
zygotic stages and strong larval expression. Y-axis indicates relative expression compared to lowest expression for that transcript (mean values
from a minimum of three independent samples replicated twice). X-axis indicates developmental stage. Bars represent standard error of the
mean. Image published in: Grant PA et al. (2014) Copyright © 2014. Image reproduced with permission of the Publisher, John Wiley & Sons. Larger Image Printer Friendly View |