XB-IMG-132115
Xenbase Image ID: 132115
|
|
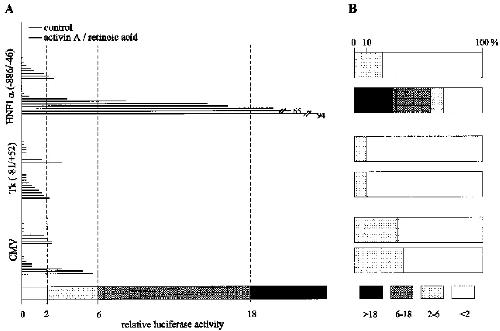
Fig. 4. Specific activation of the luciferase gene driven by the HNF1a promoter (-886/-46) in
ectoderm explants treated with activin A and retinoic acid. (A) Luciferase activities in individual
animal caps incubated in the absence or presence of inducers are given as relative values compared to
the mean activity in untreated explants. The mean value was 2100, 3300 and 1200000 light units for
the HNF1a, the tk and the cytomegalo virus promoter, respectively. Relative activities are scored into
four groups beginning with less than 2-fold activated (white colour) up to more than 18-fold activated
(black colour) as indicated by the dotted lines. (B) Diagram showing the percentage of animal caps
scored into the groups as defined in (A). Image published in: Weber H et al. (1996) Copyright © 1996. Image reproduced with permission of the publisher and the copyright holder. This is an Open Access article distributed under the terms of the Creative Commons Attribution License. Larger Image Printer Friendly View |