XB-IMG-134645
Xenbase Image ID: 134645
|
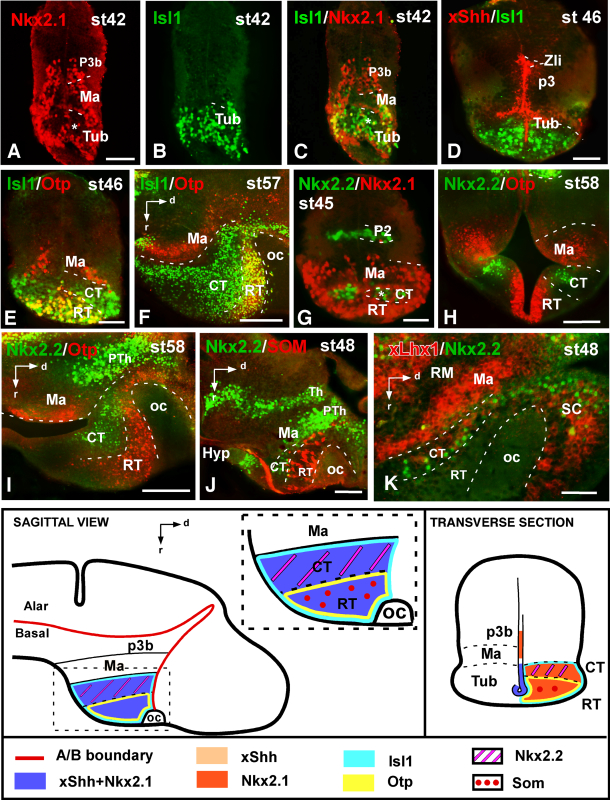
Figure 3. Photomicrographs of transverse (A–E,G,H) and sagittal (F,I–K) sections through the hypothalamus of Xenopus showing in the tuberal region and adjacent areas the expressions of Nkx2.1 (A) and Isl1 (B), and the combined expressions of Isl1 and Nkx2.1 (C), xShh and Isl1 (D), Isl1 and Otp (E,F), Nkx2.2 and Nkx2.1 (G), Nkx2.2 and otp (H,I), Nkx2.2 and SOM (J), and xLhx1 and Nkx2.2 (K). Developmental stages are indicated in each photograph. The schematic representations at the bottom summarize the combinatorial codes of the markers in the tuberal hypothalamus in a lateral view of the brain and a transverse section. A magenta-green version of this figure is provided as Supporting Information Fig. 2. Scale bars = 100 μm (in A is valid for B,C). Image published in: Domínguez L et al. (2014) Copyright © 2014. Image reproduced with permission of the Publisher. Larger Image Printer Friendly View |