XB-IMG-134832
Xenbase Image ID: 134832
|
|
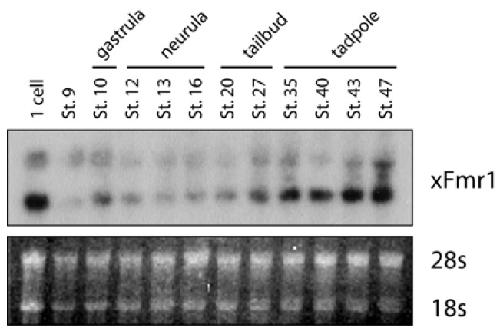
Fig. 2 (Left). Northern blot analysis of Fmr1 expression during Xenopus
embryonic development. Fmr1 transcripts are approximately 2.1kb
(bottom band; top band is non-specific) and are present maternally (1 cell).
Zygotic expression begins at early gastrula (st. 10) and gradually increases
through tadpole stage (st. 47). A noticeable spike in Fmr1 trancript levels
is observed from st. 20 to st. 27. Image published in: Lim JH et al. (2005) Copyright © 2005. Reproduced with permission of the Publisher, University of the Basque Country Press. Larger Image Printer Friendly View |