XB-IMG-135475
Xenbase Image ID: 135475
|
|
Figure 3.
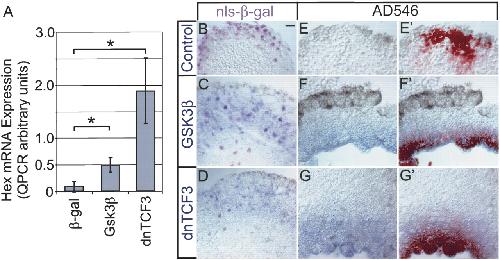
Induction of Hex mRNA by Gsk3β and dnTCF3. (A) Embryos were injected with synthetic mRNA for Gsk3β and dnTCF into one ventral blastomere of a 4-8-cell-stage embryo. Noncardiogenic VMZ explants were dissected at the onset of gastrulation (stage 10.25-10.5) then analyzed for mRNA levels by quantitative RT-PCR (mean of four experiments ± standard error). The asterisk indicates a statistically significant difference (t-test) from control β-gal-injected samples for VMZ explants expressing Gsk3β (P ≤ 0.031) and dnTCF3 (P ≤ 0.032). (B-D) Examples of induction visualized by in situ hybridization and staining for β-galactosidase. Control injection of nls-β-gal did not induce Hex (B), whereas Gsk3β (C) or dnTCF3 (D) both induced Hex. In contrast to induction of cardiac markers, the spatial domain of Hex-positive cells largely overlapped the lineage-labeled cells. Note that some lineage-labeled cells in centers of explants do not express Hex, suggesting that induction is spatially constrained. (E-G′) Examples of induction visualized by in situ hybridization and AD546. Control injections of AD546 do not induce Hex (E), whereas injection of both GSK3b (F,F′) and dnTCF3 (G,G′) induce Hex. In situ hybridization staining is shown in F and G, and merged in situ hybridization staining and AD546 fluorescence (F′,G′) show nearly perfect overlap between cells expressing Hex and the lineage label. Bar in B represents 20 μM. Image published in: Foley AC and Mercola M (2005) Copyright © 2005. Image reproduced on with permission of the Publisher, Cold Spring Harbor Laboratory Press. This is an Open Access article. Larger Image Printer Friendly View |