XB-IMG-136566
Xenbase Image ID: 136566

|
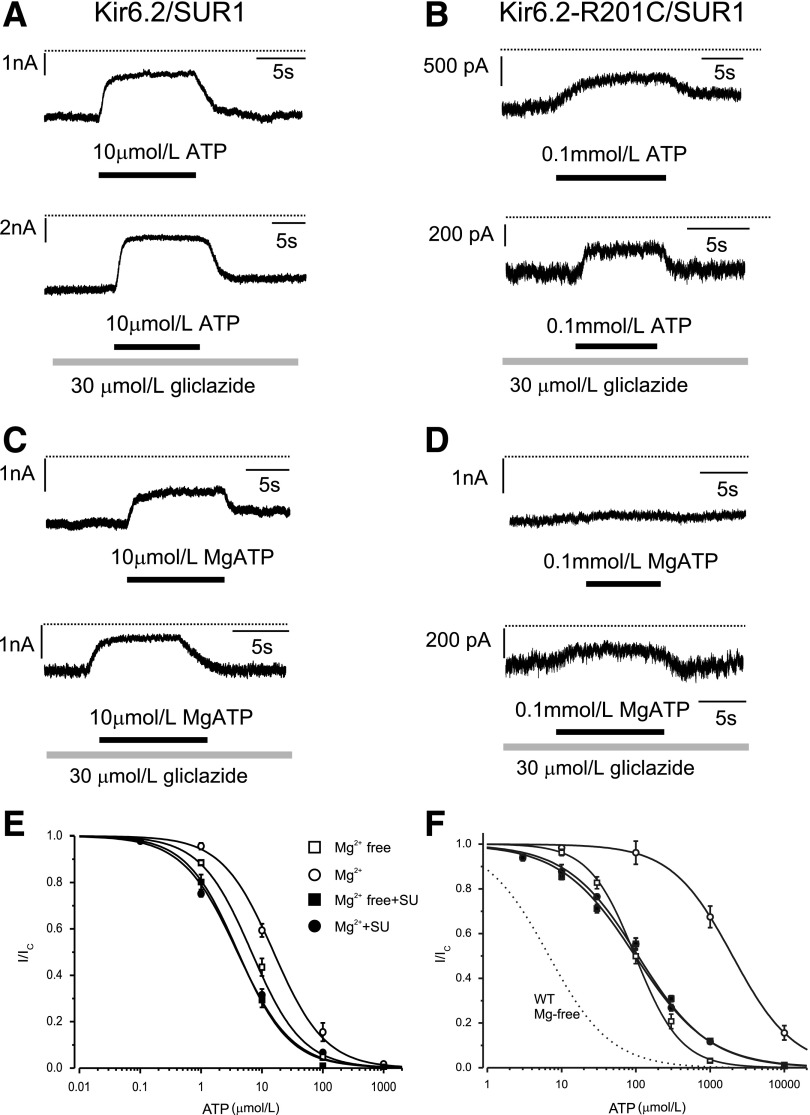
FIG. 2. Effect of gliclazide on ATP block of wild-type and R201C KATP channels. A–D: Representative Kir6.2/SUR1 (A and C) and Kir6.2-R201C/SUR1 (B and D) currents recorded at −60 mV in the absence (A and B) and presence (C and D) of Mg2+. Gliclazide and ATP were added as indicated by the bars. The dotted line indicates the zero current level. E and F: ATP concentration-inhibition curves for Kir6.2/SUR1 (E) and Kir6.2-R201C/SUR1 (F) channels measured in the absence of both gliclazide (SU) and Mg2+ (□) and in the absence of gliclazide but in the presence of 2 mmol/L Mg2+ (○), 30 μmol/L gliclazide without Mg2+ (■), and 30 μmol/L gliclazide plus 2 mmol/L Mg2+ (●). The lines are the best fit of Eq. 1 to the mean data with the following parameters: Kir6.2/SUR1 (E) IC50 = 6.8 μmol/L, h = 1.0 (□); IC50 = 4 μmol/L, h = 1.0 (■); IC50 = 16 μmol/L, h = 1.0 (○); and IC50 = 4 μmol/L, h = 0.97 (●) and Kir6.2-R201C/SUR1 (F): IC50 = 98 μmol/L, h = 1.4 (□); IC50 = 2.0 mmol/L, h = 1.1 (○); IC50 = 97 μmol/L, h = 0.87 (■); and IC50 = 107 μmol/L, h = 0.90 (●). The dotted line is the concentration-inhibition curve for Kir6.2/SUR1 channels in the absence of Mg2+ and gliclazide (Fig. 2E) (□). SU, sulfonylurea; WT, wild-type. Image published in: Proks P et al. (2013) © 2013 by the American Diabetes Association. Creative Commons Attribution-NonCommercial-NoDerivatives license Larger Image Printer Friendly View |
