XB-IMG-137012
Xenbase Image ID: 137012
|
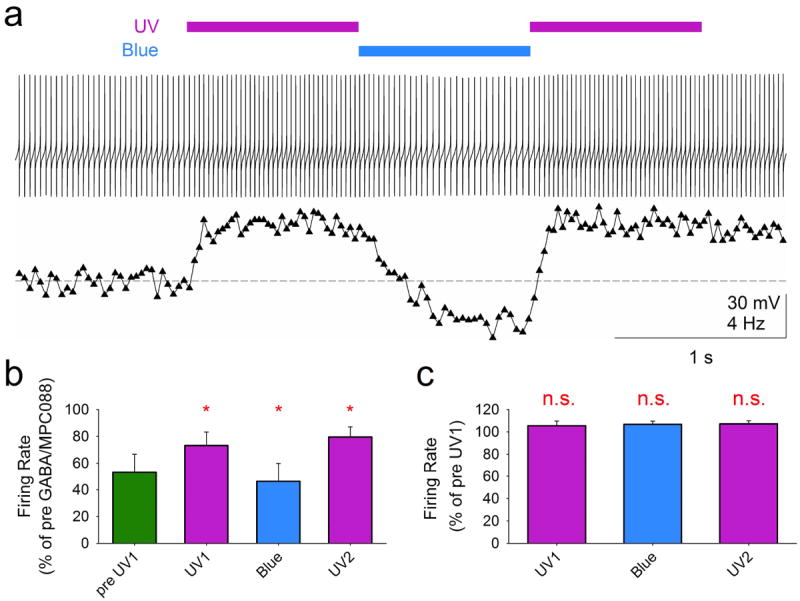
Figure 7. Effect of MPC088 photoactivation on action potential firing frequency in PNsa: Representative data obtained by whole-cell current-clamp recording from a PN which was injected with 468 pA to elicit a high-frequency train of action potentials. During this current step, 10 μM GABA + 30 μM trans-dominant MPC088 were applied via pressure pipette for 10 s. The cell was then exposed for 1-s durations to UV light (UV1), then blue light, and then again with UV (UV2). The entire illustrated voltage vs. time trace occurs during application of GABA/MPC088. Below this trace is plotted the instantaneous firing frequency vs. time; the dashed line reflects the average firing frequency during the 1-s epoch that preceded the first UV exposure. b: Summary of results from experiments of the type shown in a. Average spike frequencies were obtained for each cell in each of five 1-s epochs, then normalized to the pre-GABA/MPC088 firing frequency (n = 8 cells from 4 animals). Error bars here and in c represent the SEM. Repeated-measures ANOVA on the aggregate data yielded F(3,21) = 10.213, p < 0.001. Red asterisks above the purple and blue bars indicate significance of the average frequency in that epoch vs.the preceding epoch (e.g., the asterisk above the UV1 bar refers to significance of the average firing rate in the UV1 epoch vs. the GABA/MPC088 pre-UV epoch). Significance was determined from post-hoc paired-sample t-tests corrected for multiple comparisons, which yielded p < 0.02. c: Summary of results from experiments similar to that described in a, but in which the cell was exposed only to the UV/Blue/UV flash sequence (i.e., no GABA/MPC088 applied). Data normalized to the average firing frequency during the 1-s period preceding the first UV flash (n = 7 cells from 3 animals). Repeated-measures ANOVA on the aggregate data yielded F(3,18) = 3.057, p > 0.05. Three post-hoc statistical tests were then performed as described in b; none of these yielded significance at the uncorrected 0.05 level. Image published in: Yue L et al. (2012) Image downloaded from an Open Access article in PubMed Central. Image reproduced on Xenbase with permission of the publisher and the copyright holder. Larger Image Printer Friendly View |