XB-IMG-138123
Xenbase Image ID: 138123
|
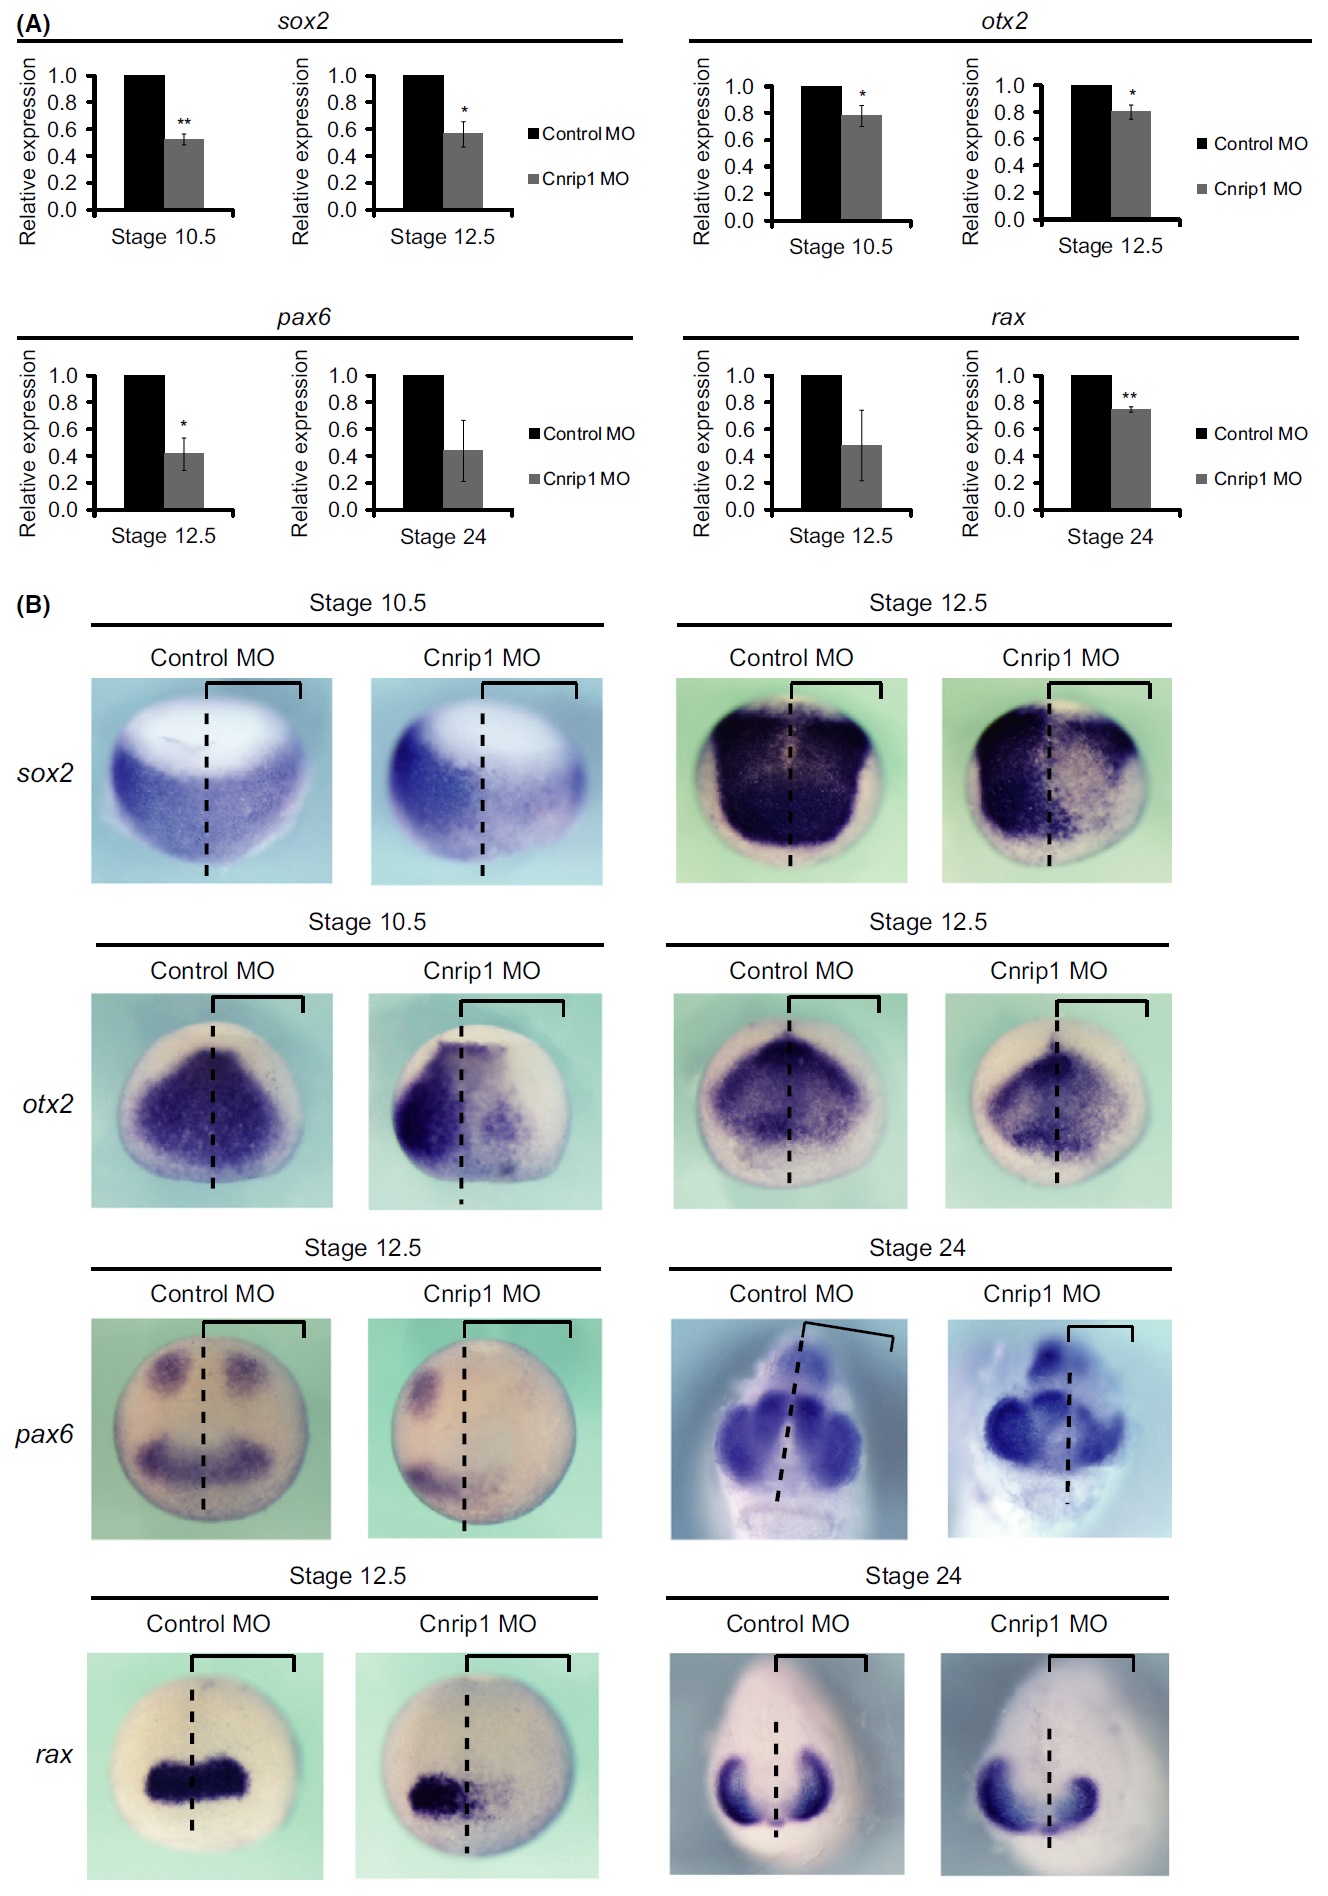
Figure 3 cnrip1 knockdown reduces expression of sox2, otx2, pax6 and rax. (A) qRT-PCR analysis for the pan-neural marker
sox2 (stage 10.5 and 12.5), the anterior marker otx2 (stage 10.5 and 12.5), the eye and neural marker pax6 (stage 12.5 and 24) and
the eye marker rax (stage 12.5 and 24) in embryos injected with control MO or cnrip1 MO (10 ng each/blastomere) into the animal
region of two dorsal blastomeres at the 4-cell stage. The expression level of each gene was normalized to that of odc. Values
are mean SD of three independent experiments; **P < 0.01; *P < 0.05. (B) Whole-mount in situ hybridization was carried out
on MO-injected embryos. Control MO or cnrip1 MO (10 ng each) was injected into the animal region of the left dorsal blastomere
at the 4-cell stage. The expression of sox2, otx2, pax6 and rax was reduced in 100% of cnrip1 MO-injected embryos (sox2,
stage 10.5, n = 20; sox2, stage 12.5, n = 24; otx2, stage 10.5, n = 20; otx2, stage 12.5, n = 24; pax6, stage 12.5, n = 30; pax6, stage
24, n = 24; rax, stage 12.5, n = 24; rax, stage 24, n = 24). Anterior views with dorsal upwards. The representative results from
two (sox2, stage 10.5; otx2, stage 10.5) or three (sox2, stage 12.5; otx2 stage 12.5; pax6, stage 12.5 and 24; rax, stage 12.5 and 24)
independent experiments are shown. The black brackets indicate MO-injected left sides. The dashed lines indicate midlines of
embryos. Image published in: Zheng X et al. (2015) Copyright © 2015. Image reproduced with permission of the Publisher, John Wiley & Sons.
Image source: Published
Larger Image Printer Friendly View |