Click here to close Hello! We notice that you are using Internet Explorer, which is not supported by Xenbase and may cause the site to display incorrectly. We suggest using a current version of Chrome, FireFox, or Safari.
XB-IMG-138798

Xenbase Image ID: 138798


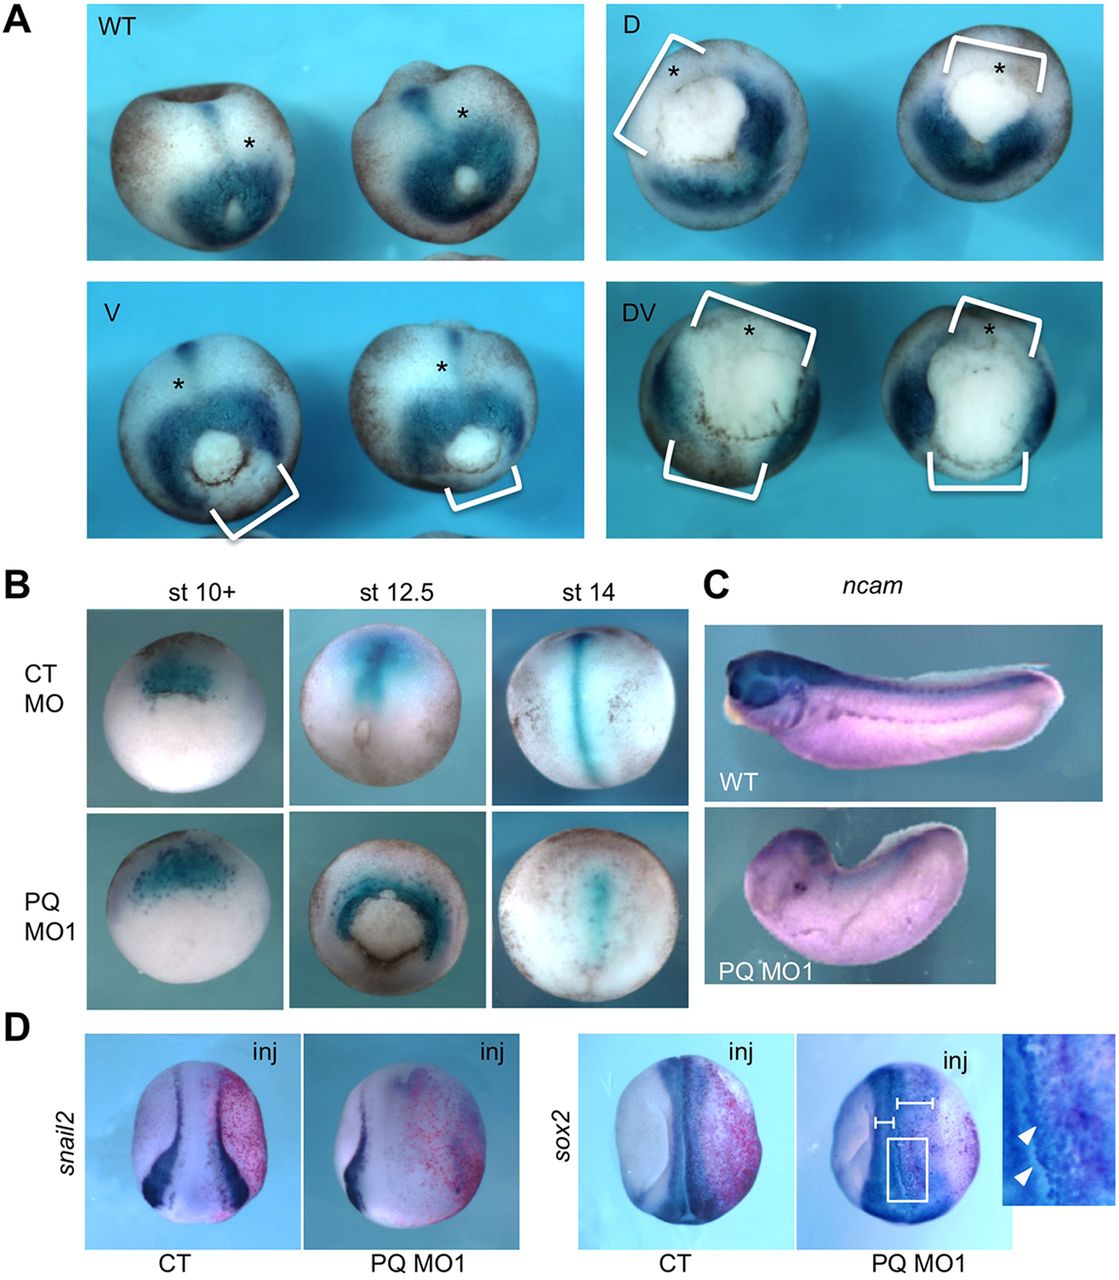
Fig. 3. The effects of PQBP1 knockdown on embryonic mesoderm and neurectoderm. (A) Expression of the pan-mesodermal marker brachyury (bra) in late gastrula (stage 12.5) embryos injected with 20 ng pqbp1 MO1 into dorsal (D), ventral (V) or both (DV) blastomeres at the four-cell stage. Note lack of bra expression wherever the pqbp1 MO was injected (white brackets). (B) Expression of the dorsal (axial) mesoderm marker chordin in embryos injected dorsally with 20 ng of either control MO (CT MO) or pqbp1 MO1 (PQ MO1) at the four-cell stage. (C) Expression of neural marker ncam in uninjected (WT) or pqbp1 MO1-injected embryos targeted dorsally as in B. Lateral views with anterior to left. (D) Expression of the neural crest marker snail2 (slug) and the neural marker sox2 in neurula embryos (stage 19) injected in a single two-cell stage blastomere with 20 ng pqbp1 MO1 or control MO (CT) along with β-galactosidase lineage tracer (red). Dorsal views with anterior down. Perturbed neural folding is shown by differences between width of left and right neural folds (brackets). Loosely adherent sox2-positive cells, marked by arrowheads in the magnified view of the boxed area. WT, wild-type control embryos.

Image published in: Iwasaki Y and Thomsen GH (2014)

Copyright © 2014. Image reproduced with permission of the publisher and the copyright holder. This is an Open Access article distributed under the terms of the Creative Commons Attribution License.

GeneSynonymsSpeciesStage(s)Tissue
tbxt.Lbra, brachyury, ntl, t, t-a, t-b, X-bra, Xbra, XbrachyuryX. laevisThroughout NF stage 12.5marginal zone
axial mesoderm
involuting marginal zone
chrd.Lchd, chordin, chrd.1, LOC108716939, X-chordinX. laevisSometime during NF stage 10 to NF stage 14dorsal marginal zone
axial mesoderm
ncam1.Ln-cam, n-cam-1, ncam, ncam1-a, ncam1-bX. laevisThroughout NF stage 28neural crest
brain
spinal cord
eye
neuron
nervous system
trunk neural crest
snai2.Lslug, snai2-a, snai2-b, Snail2, xSlu, xslug, XSnail2X. laevisThroughout NF stage 19neural crest
neural plate border
sox2.Lanop3, LOC108718087, mcops3, Sox-2, XLSOX-2, Xsox-2, XSox2X. laevisThroughout NF stage 19neural plate

Image source: Published

Experiment + Assay Source Phenotypes and Disease
Xla Wt + pqbp1 MO + NF12.5 (in situ hybridization) Fig.3.A
Anatomical Phenotype
abnormal incomplete closing of the blastopore
Expression Phenotype
decreased amount tbxt.L expression in dorsal marginal zone
decreased amount tbxt.L expression in ventral marginal zone
Xla Wt + pqbp1 MO + NF10.25 (in situ hybridization) Fig.3.B
Anatomical Phenotype
abnormal convergent extension
abnormal incomplete closing of the blastopore
Disease
Renpenning syndrome
Xla Wt + pqbp1 MO + NF28 (in situ hybridization) Fig.3.C
Anatomical Phenotype
decreased length of anterior-posterior axis
decreased size of the head
decreased size of the tail bud
Disease
Renpenning syndrome
Expression Phenotype
decreased amount ncam1.L expression in brain
decreased amount ncam1.L expression in nervous system
decreased amount ncam1.L expression in trunk neural crest
Xla Wt + pqbp1 MO + NF19 (in situ hybridization) Fig.3.D
Anatomical Phenotype
abnormal neural fold morphology
decreased cell adhesion in neuroectoderm
Disease
Renpenning syndrome
Expression Phenotype
decreased amount snai2.L expression in neural crest
decreased amount snai2.L expression in neural plate border
decreased amount sox2.L expression in neural plate

Larger Image
Printer Friendly View

Return to previous page