XB-IMG-139633
Xenbase Image ID: 139633
|
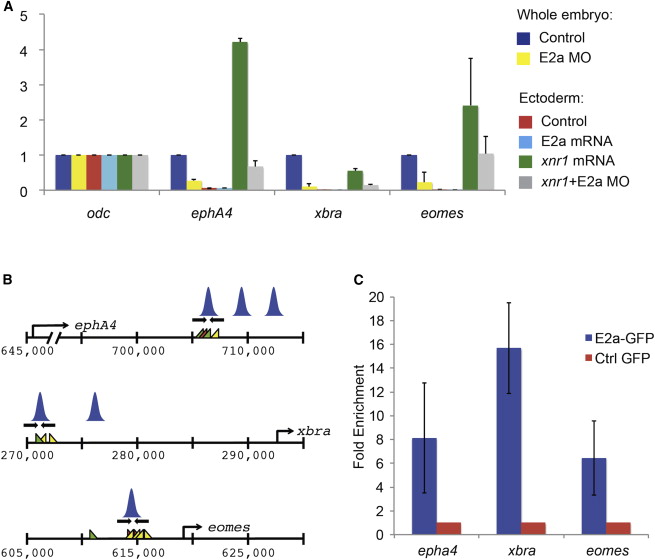
Figure 4. E2a Is Required for Dorsal Mesoderm Gene Expression and Binds Directly to These Target Genes
(A) qRT-PCRs comparing expression of xbra, eomes, and epha4 in whole stage 10.5 control or e2a-depleted embryos and in ectoderm explants. Expression levels are normalized to odc and to control ectoderm explants. Error bars represent the SD for three biological replicates, with two technical replicates per biological replicate. Note that although error bars for eomes expression are large, reflecting biological variation between groups of explants, eomes expression was lower in E2a MO + Xnr1 ectoderm than in Xnr1 ectoderm in every biological replicate.
(B) Regulatory regions for eomes, epha4, and xbra were identified from ChIP-seq analysis in Figure 1, and regulatory regions that are occupied by Smad2/3 in both control and e2a-depleted embryos were analyzed for E2a occupancy. Primers, Smad, FoxH1, and E2a (SCA) binding sites as well as the positions of Smad2/3 peaks are shown as in Figure 2.
(C) ChIP-qRT-PCR for mE2a-GFP shows significant enrichment at regulatory regions for eomes, xbra, and epha4. qRT-PCRs are normalized to expression in embryos injected with GFP alone, and to expression of an off-peak primer. Error bars represent SDs of two to three biological replicates.
See also Figure S3. Image published in: Wills AE and Baker JC (2015) Copyright © 2015. Image reproduced with permission of the Publisher, Elsevier B. V. Larger Image Printer Friendly View |