XB-IMG-139777
Xenbase Image ID: 139777
|
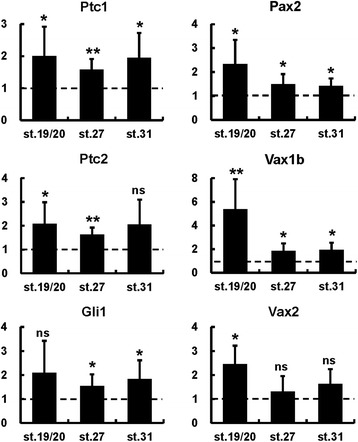
Figure 5.
Quantification of gene expression changes following
VP16-Gli1-GR
overexpression. Real-time PCR quantification of gene expression in st. 33 heads dissected from controls or from embryos injected with VP16-Gli1-GR mRNA and treated with dex from the indicated stages. Results are shown as the mean ratio between VP16-Gli1-GR-injected and control embryos in six independent experiments. Error bars show standard deviations. *P < 0.05; **P < 0.01; ns, non-significant (P ≥ 0.05) according to two-tailed Student’s t-test. Image published in: Wang X et al. (2015) © Wang et al. This image is reproduced with permission of the journal and the copyright holder. This is an open-access article distributed under the terms of the Creative Commons Attribution license Larger Image Printer Friendly View |