XB-IMG-146771
Xenbase Image ID: 146771
|
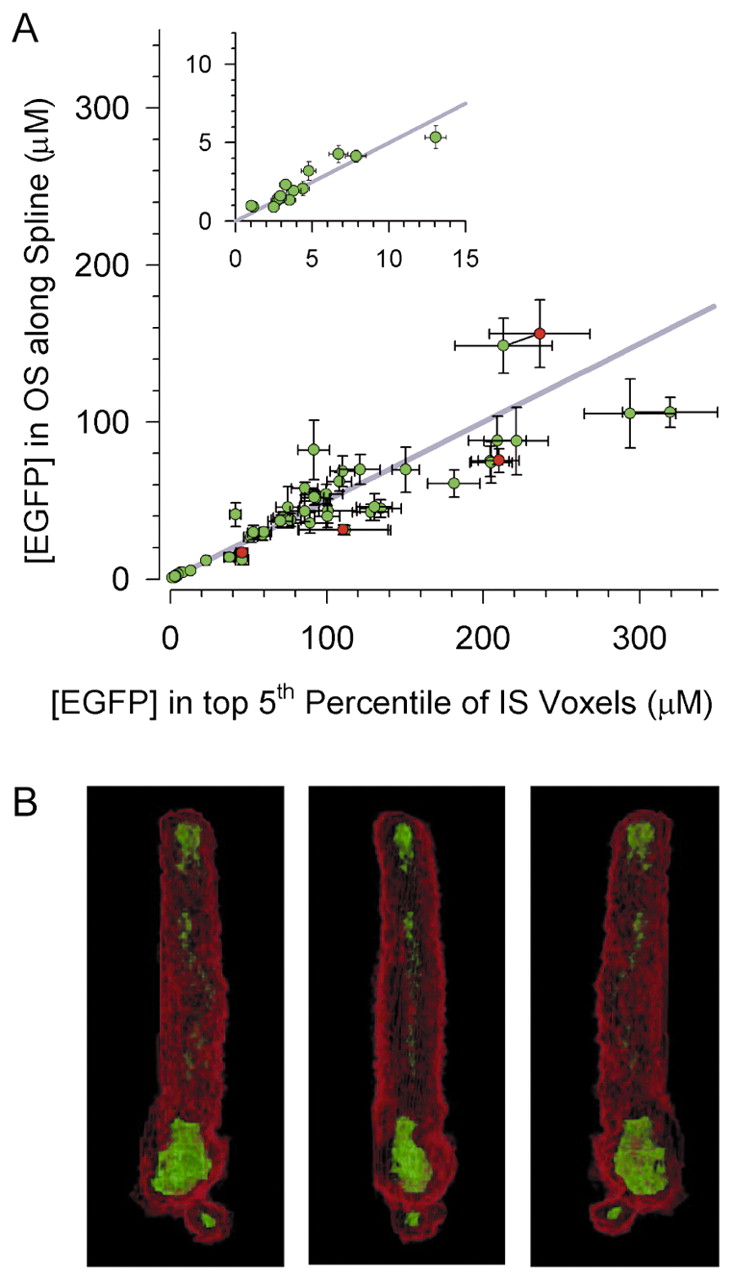
Fig.5. Quantitative test of the EGFP equilibration hypothesis in Xenopus rod cells. (A) Each point gives the average concentration of EGFP in a rod OS derived from a profile analysis such as illustrated in Fig. 5A,B, plotted as a function of the maximal concentration of EGFP in the rod IS. The gray lines have a slope of G and plot the prediction of the EGFP equilibration hypothesis that the OS should exhibit 50% of the fluorescence intensity of the brightest voxels of the IS. The inset shows the distribution in the lowest corner of the main plot, i.e. the initial 15 μM of the abscissa on an expanded scale. The red circles plot scan data of cells after a complete bleaching exposure; pre-bleach scans of the same cells were unchanged. (B) Display of the brightest 5% of the voxels (green) and the dimmest 5% (red) of the rod identified by the arrow in Fig. 3B; three orientations of the rod are provided. Autofluorescence levels of control rods were comparable with those of CHO cells (Fig. 1D) under our experimental conditions, and thus negligible in comparison with cells having average [EGFP] in the micromolar range. Image published in: Peet JA et al. (2004) Copyright © 2004. Image reproduced with permission of the Publisher, The Company of Biologists Ltd. Larger Image Printer Friendly View |