XB-IMG-1473
Xenbase Image ID: 1473
|
|||||||||||||||
|
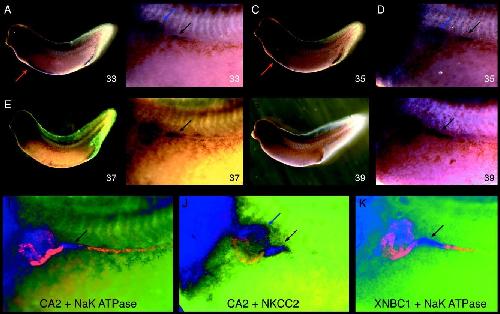
Figure 2. Expression of CA2 in Xenopus laevis embryos. In situ hybridization and fluorescence colorimetric in situ (FCIS) was used to localize CA2 expression in the developing pronephros. Red arrows indicate expression in ventral blood islands, blue arrows light staining in the pronephric proximal tubules, and black arrows strong pronephric late distal segment staining. The numbers in the lower right of each panel indicate developmental stage (Nieuwkoop and Faber, [1994]). A-H: CA2 expression. A: Stage 33 embryo displaying expression in the pronephros and ventral blood islands. B: Enlargement of A. Light staining is observed in the proximal tubules and darker staining in the late distal segment. C,D: Stage 35 embryo. E,F: Stage 37 embryo. G,H: Stage 39 embryo. I: FCIS showing CA2 expression with a sodium-potassium ATPase counterstain. Pink indicates weak overlap, orange no overlap. Strong CA2 expression appears blue. J: FCIS combining CA2 staining with a NKCC2 counterstain. There is no overlap in the early distal segment, which is orange. K: FCIS showing XNBC1 (blue) with a sodium potassium ATPase counterstain. Localization of XNBC1 is indistinguishable from that of CA2 shown in I. (K is reproduced from Zhou and Vize, Dev Biol 271:322-338, and is copyrighted by Elsevier 2004.) Image published in: Zhou X and Vize PD (2005) Copyright © 2005. Image reproduced with permission of the Publisher, John Wiley & Sons.
Image source: Published Larger Image Printer Friendly View |