XB-IMG-147467
Xenbase Image ID: 147467
|
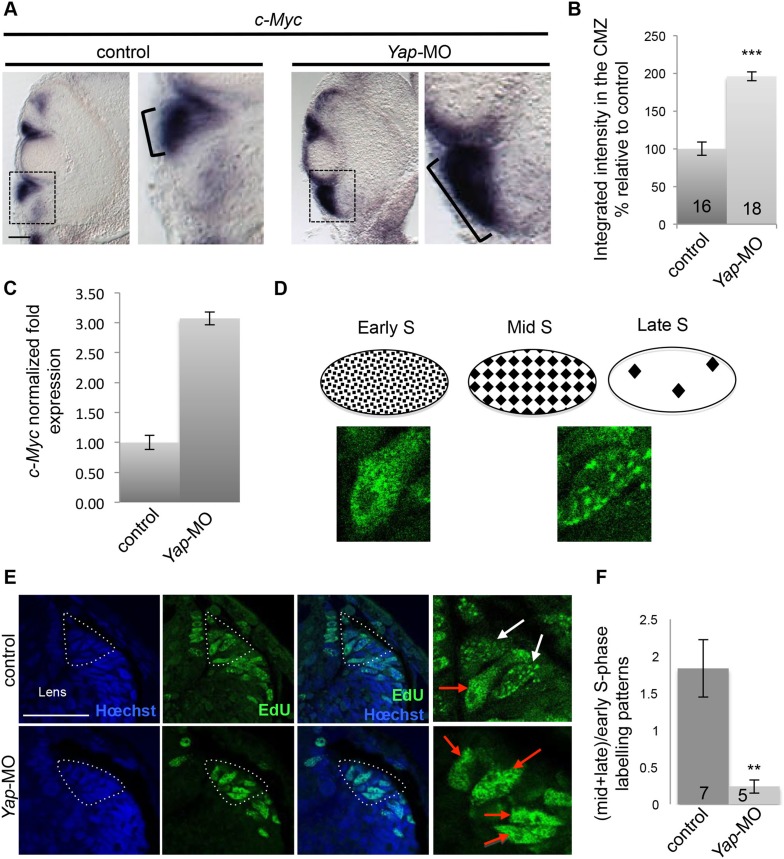
Figure 5. Yap loss of function affects the temporal program of retinal stem cell DNA replication.(A) In situ hybridization analysis of c-Myc expression on stage 40 retinal sections following two-cell stage microinjection of Yap-5-mismatch-MO (control) or Yap-MO. Images on the right show higher magnifications of the CMZ (dotted lines). Note the strong expansion of c-Myc expression area (bracket). (B) Quantification of the staining in the CMZ. The number of analyzed retinal sections per condition is indicated in each bar. (C) qPCR analysis of c-Myc expression in the retina of tadpoles injected as in (A). (D) Schematic representation of replication foci observed during S-phase progression, as inferred from EdU labeling. Pictures illustrate two examples of EdU-labeled foci observed in control CMZ cells, one homogenous (early S-phase) and one with large dots (mid/late S-phase). (E) Analysis of EdU-labeled replication foci (1 hr-pulse) in the CMZ of stage 40 tadpoles injected as in (A). Enlargements of the CMZ tip (dotted lines) are shown on the right. Early (red arrows) and mid/late profiles (white arrows) were distinguished. (F) Corresponding quantification. The number of analyzed retinas per condition is indicated in each bar. Data are represented as mean ± SEM. Scale bar = 40 µm.DOI:
http://dx.doi.org/10.7554/eLife.08488.012 Image published in: Cabochette P et al. (2015) © 2015, Cabochette et al. This image is reproduced with permission of the journal and the copyright holder. This is an open-access article distributed under the terms of the Creative Commons Attribution license
Image source: Published Larger Image Printer Friendly View |