XB-IMG-148936
Xenbase Image ID: 148936
|
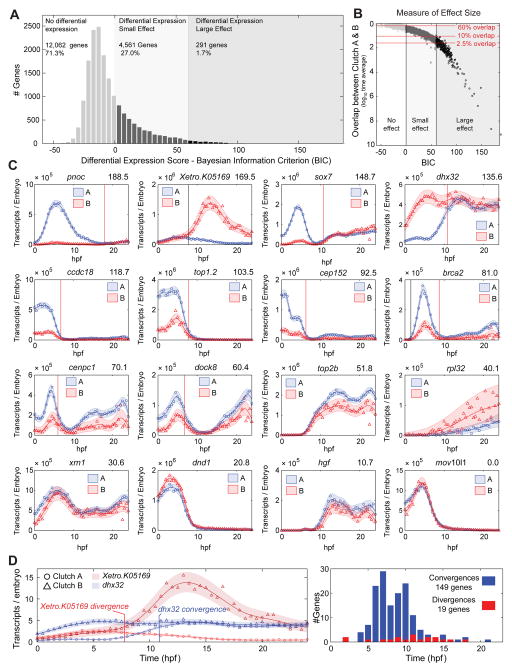
Clutch A vs Clutch B PolyA+ Differential Expression
A – Clutch A vs Clutch B histogram of differential expression scores as measured by the Bayesian Information Criterion (BIC), larger scores indicate greater differential expression (Supplemental Experimental Procedures). Three regions marked: 1) no differential expression BIC ≤ 0, 2) differential expression small effect 0 < BIC ≤ 60, 3) differential expression large effect BIC > 60. See B for explanation of thresholds.
B – Differential expression effect size as measured by the log10 mean overlap between Clutch A and Clutch B Gaussian process models (Supplemental Experimental Procedures). Mean overlap decreases with increasing BIC. BIC = 0, 60 and mean overlaps of 60%, 10% and 2.5% marked. At BIC = 60 approximately all genes have less than 10% overlap, and all genes with less than 2.5% overlap have BIC > 60.
C – Differential expression examples with decreasing BIC (top right). Genes on the boundary for strong differential expression have highly correlated expression profiles in A and B. Vertical lines mark convergences (red) or divergences (black).
D – Left: Examples of convergence (dhx32) and divergence (Xetro.K05169). Right: Histogram of convergence and divergence times. Image published in: Owens ND et al. (2016) Copyright © 2016. Image reproduced with permission of the Publisher and the copyright holder. This is an Open Access article distributed under the terms of the Creative Commons Attribution License. Larger Image Printer Friendly View |