XB-IMG-148942
Xenbase Image ID: 148942

|
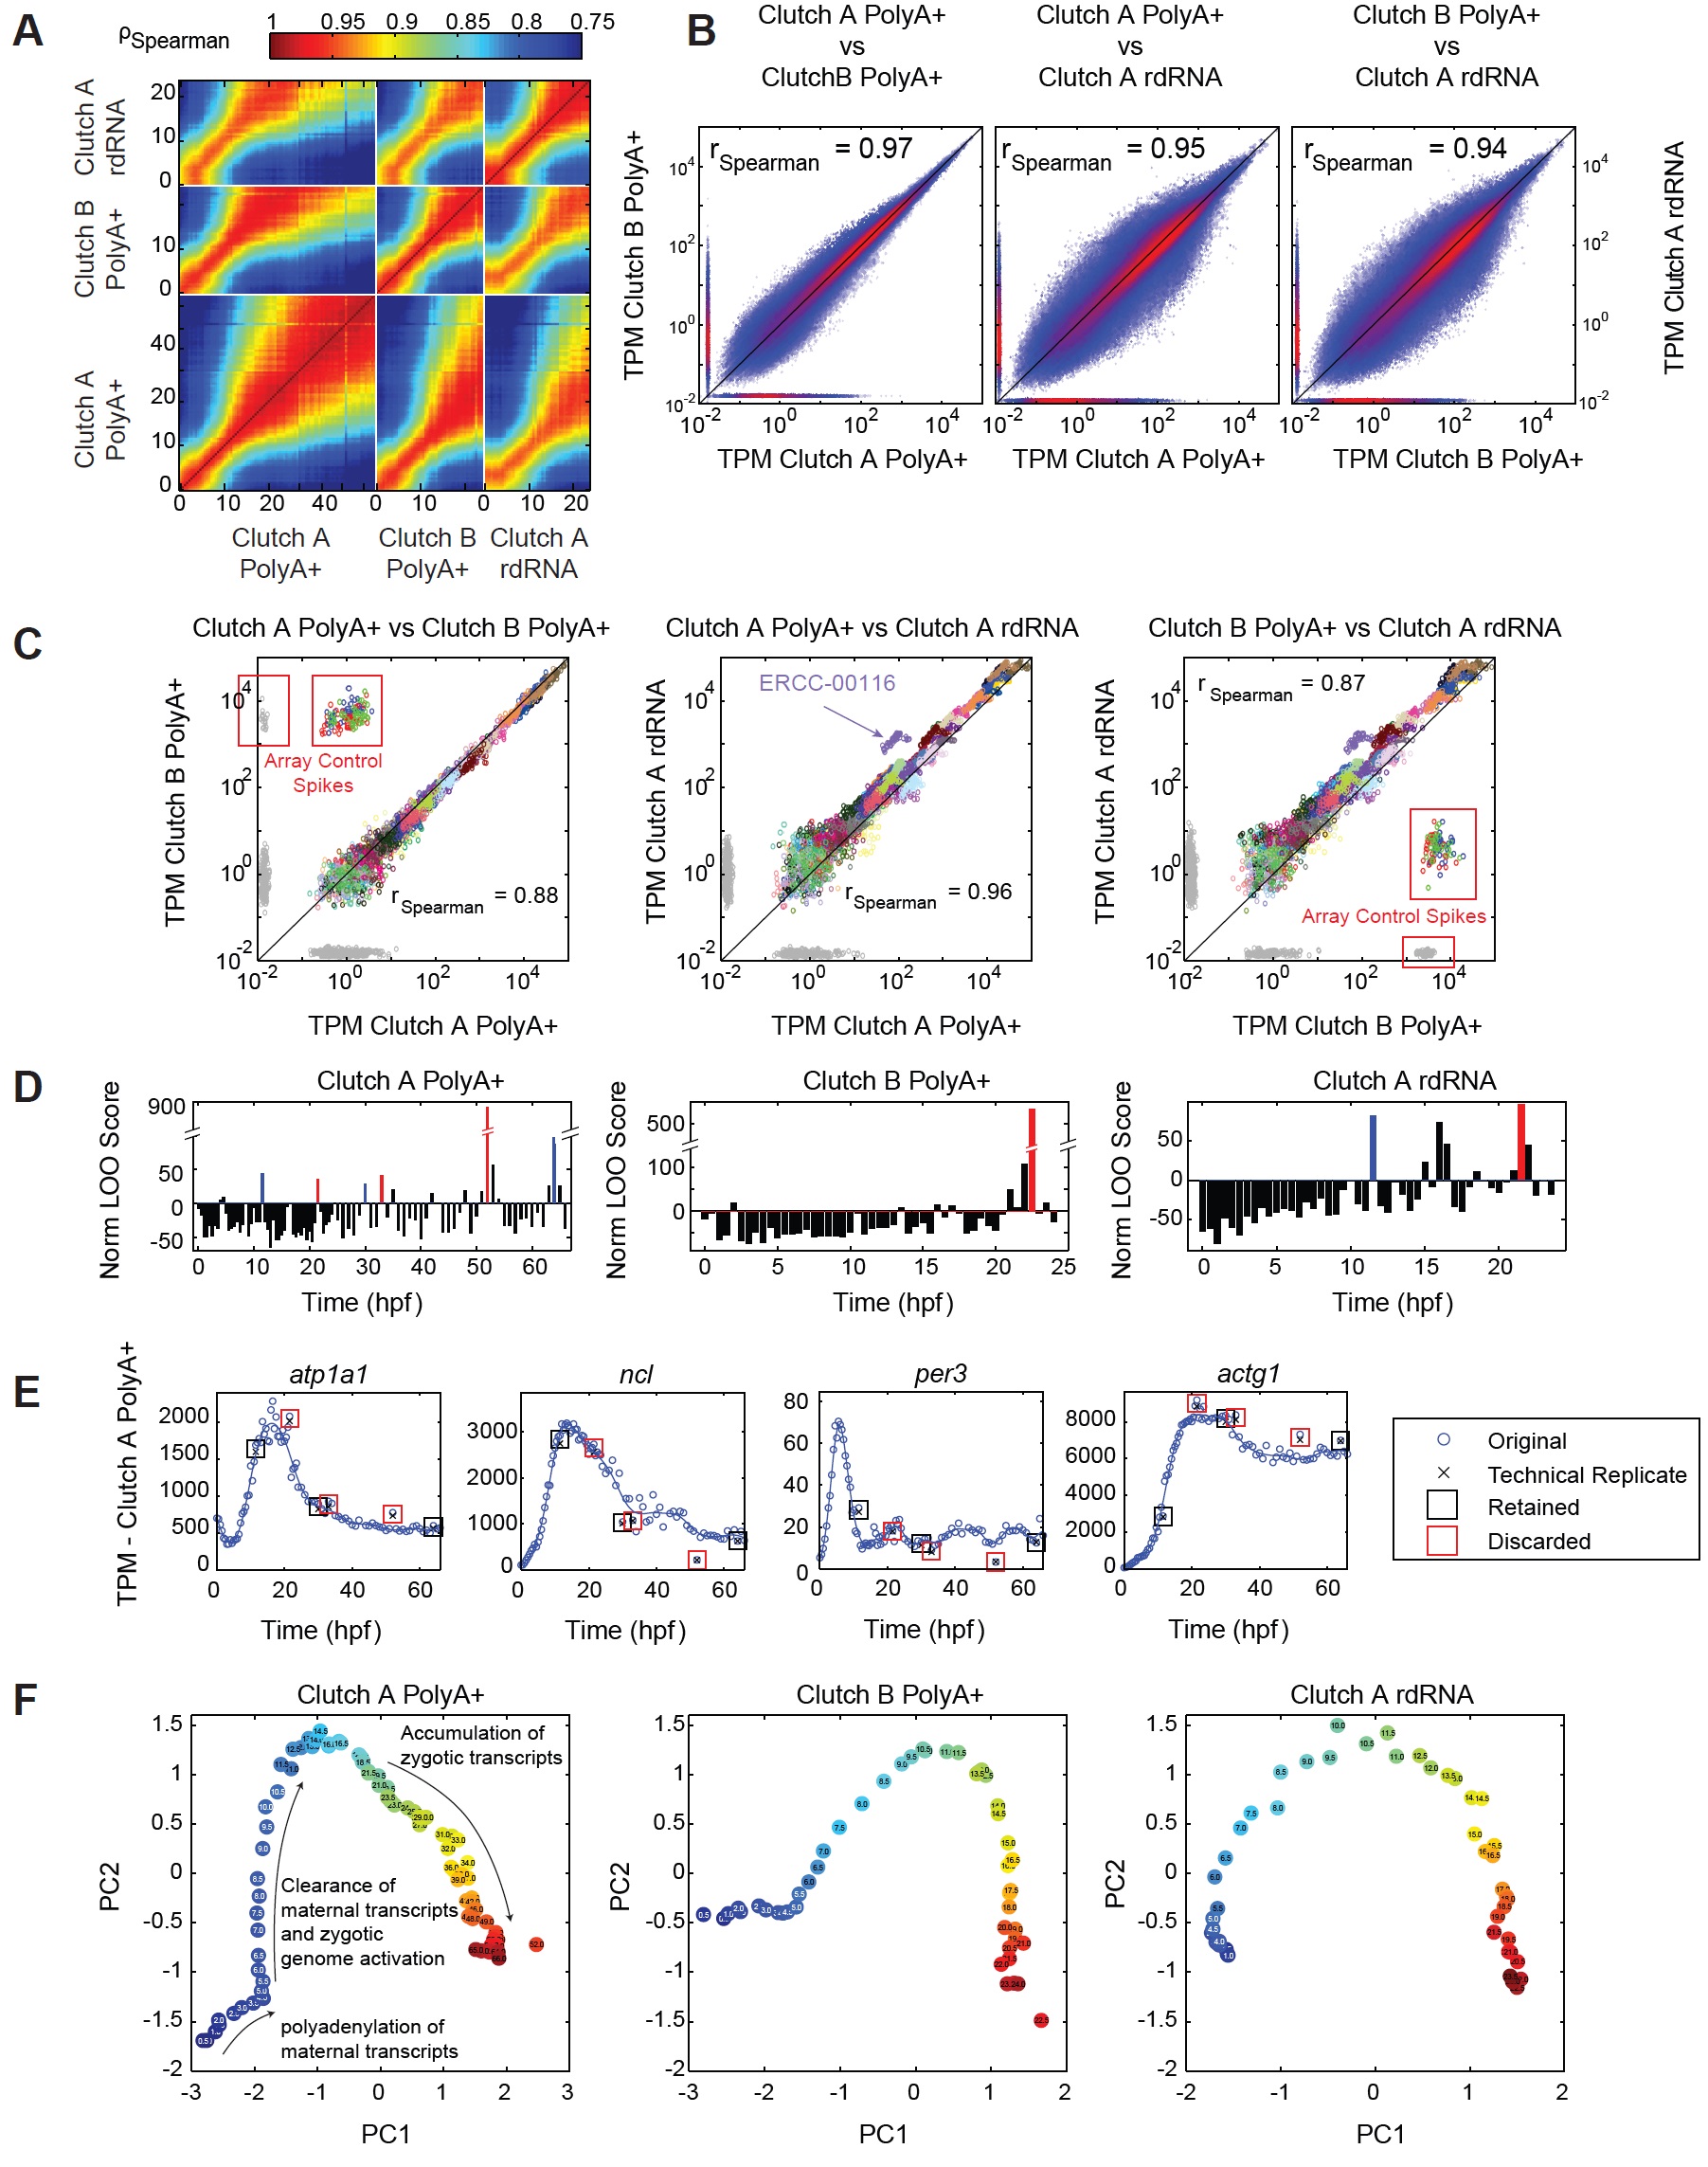
Fig S1 – RNA-seq data quality, related to Fig 1, Supplemental Experimental
Procedures
(A) Spearman correlation between all pairs of all samples for relative normalized TPM
abundances. Neighboring samples are as correlated as replicates.
(B) Scatter plots of all TPM abundances for all samples. Color indicates density of points.
Horizontal and vertical strips indicate measurements only present in one sample.
(C) RNA standard performance. Scatter plots compare RNA standard TPM abundances
between all pairs of datasets. Color indicates spike-in species. Red boxes mark ArrayControl
spikes present only in Clutch B PolyA+. Although, we find small numbers of reads that align
uniquely to ArrayControl sequences when ArrayControl spikes are not present in the sample.
We note that this is not true for ERCC spikes, we never find ERCC reads when ERCC
spikes are not present (data not shown). ERCC PolyA+ and rdRNA comparisons lie off the
diagonal indicating poor PolyA+ performance. ERCC-00116 has the worst PolyA+
performance and is not used in absolute normalization.
(D) Identification of poorly performing libraries. Normalized leave-one-out score
(Supplemental Experimental Procedures), higher scores indicate a poorly performing
sample. Samples adjacent to a bad sample can also receive high scores. Red and blue
samples in Clutch A PolyA+ are selected for repeat library construction and sequencing (E).
Red samples excluded from all analysis.
(E) Technical replicates in Clutch A PolyA+ of poorly performing samples reveal that the
poor performance is highly reproducible indicating that performance issues are not due to
library construction and sequencing. Red boxes marked those discarded, black boxes
marked those retained.
(F) Projections onto the first two principle components for Clutch A PolyA+ (left), Clutch B
PolyA+ (center), and Clutch A rdRNA (right). Note strong temporal correlation between
samples, major changes in the transcriptome are visible. Image published in: Owens ND et al. (2016) Copyright © 2016. Image reproduced with permission of the Publisher and the copyright holder. This is an Open Access article distributed under the terms of the Creative Commons Attribution License. Larger Image Printer Friendly View |
