XB-IMG-148948
Xenbase Image ID: 148948

|
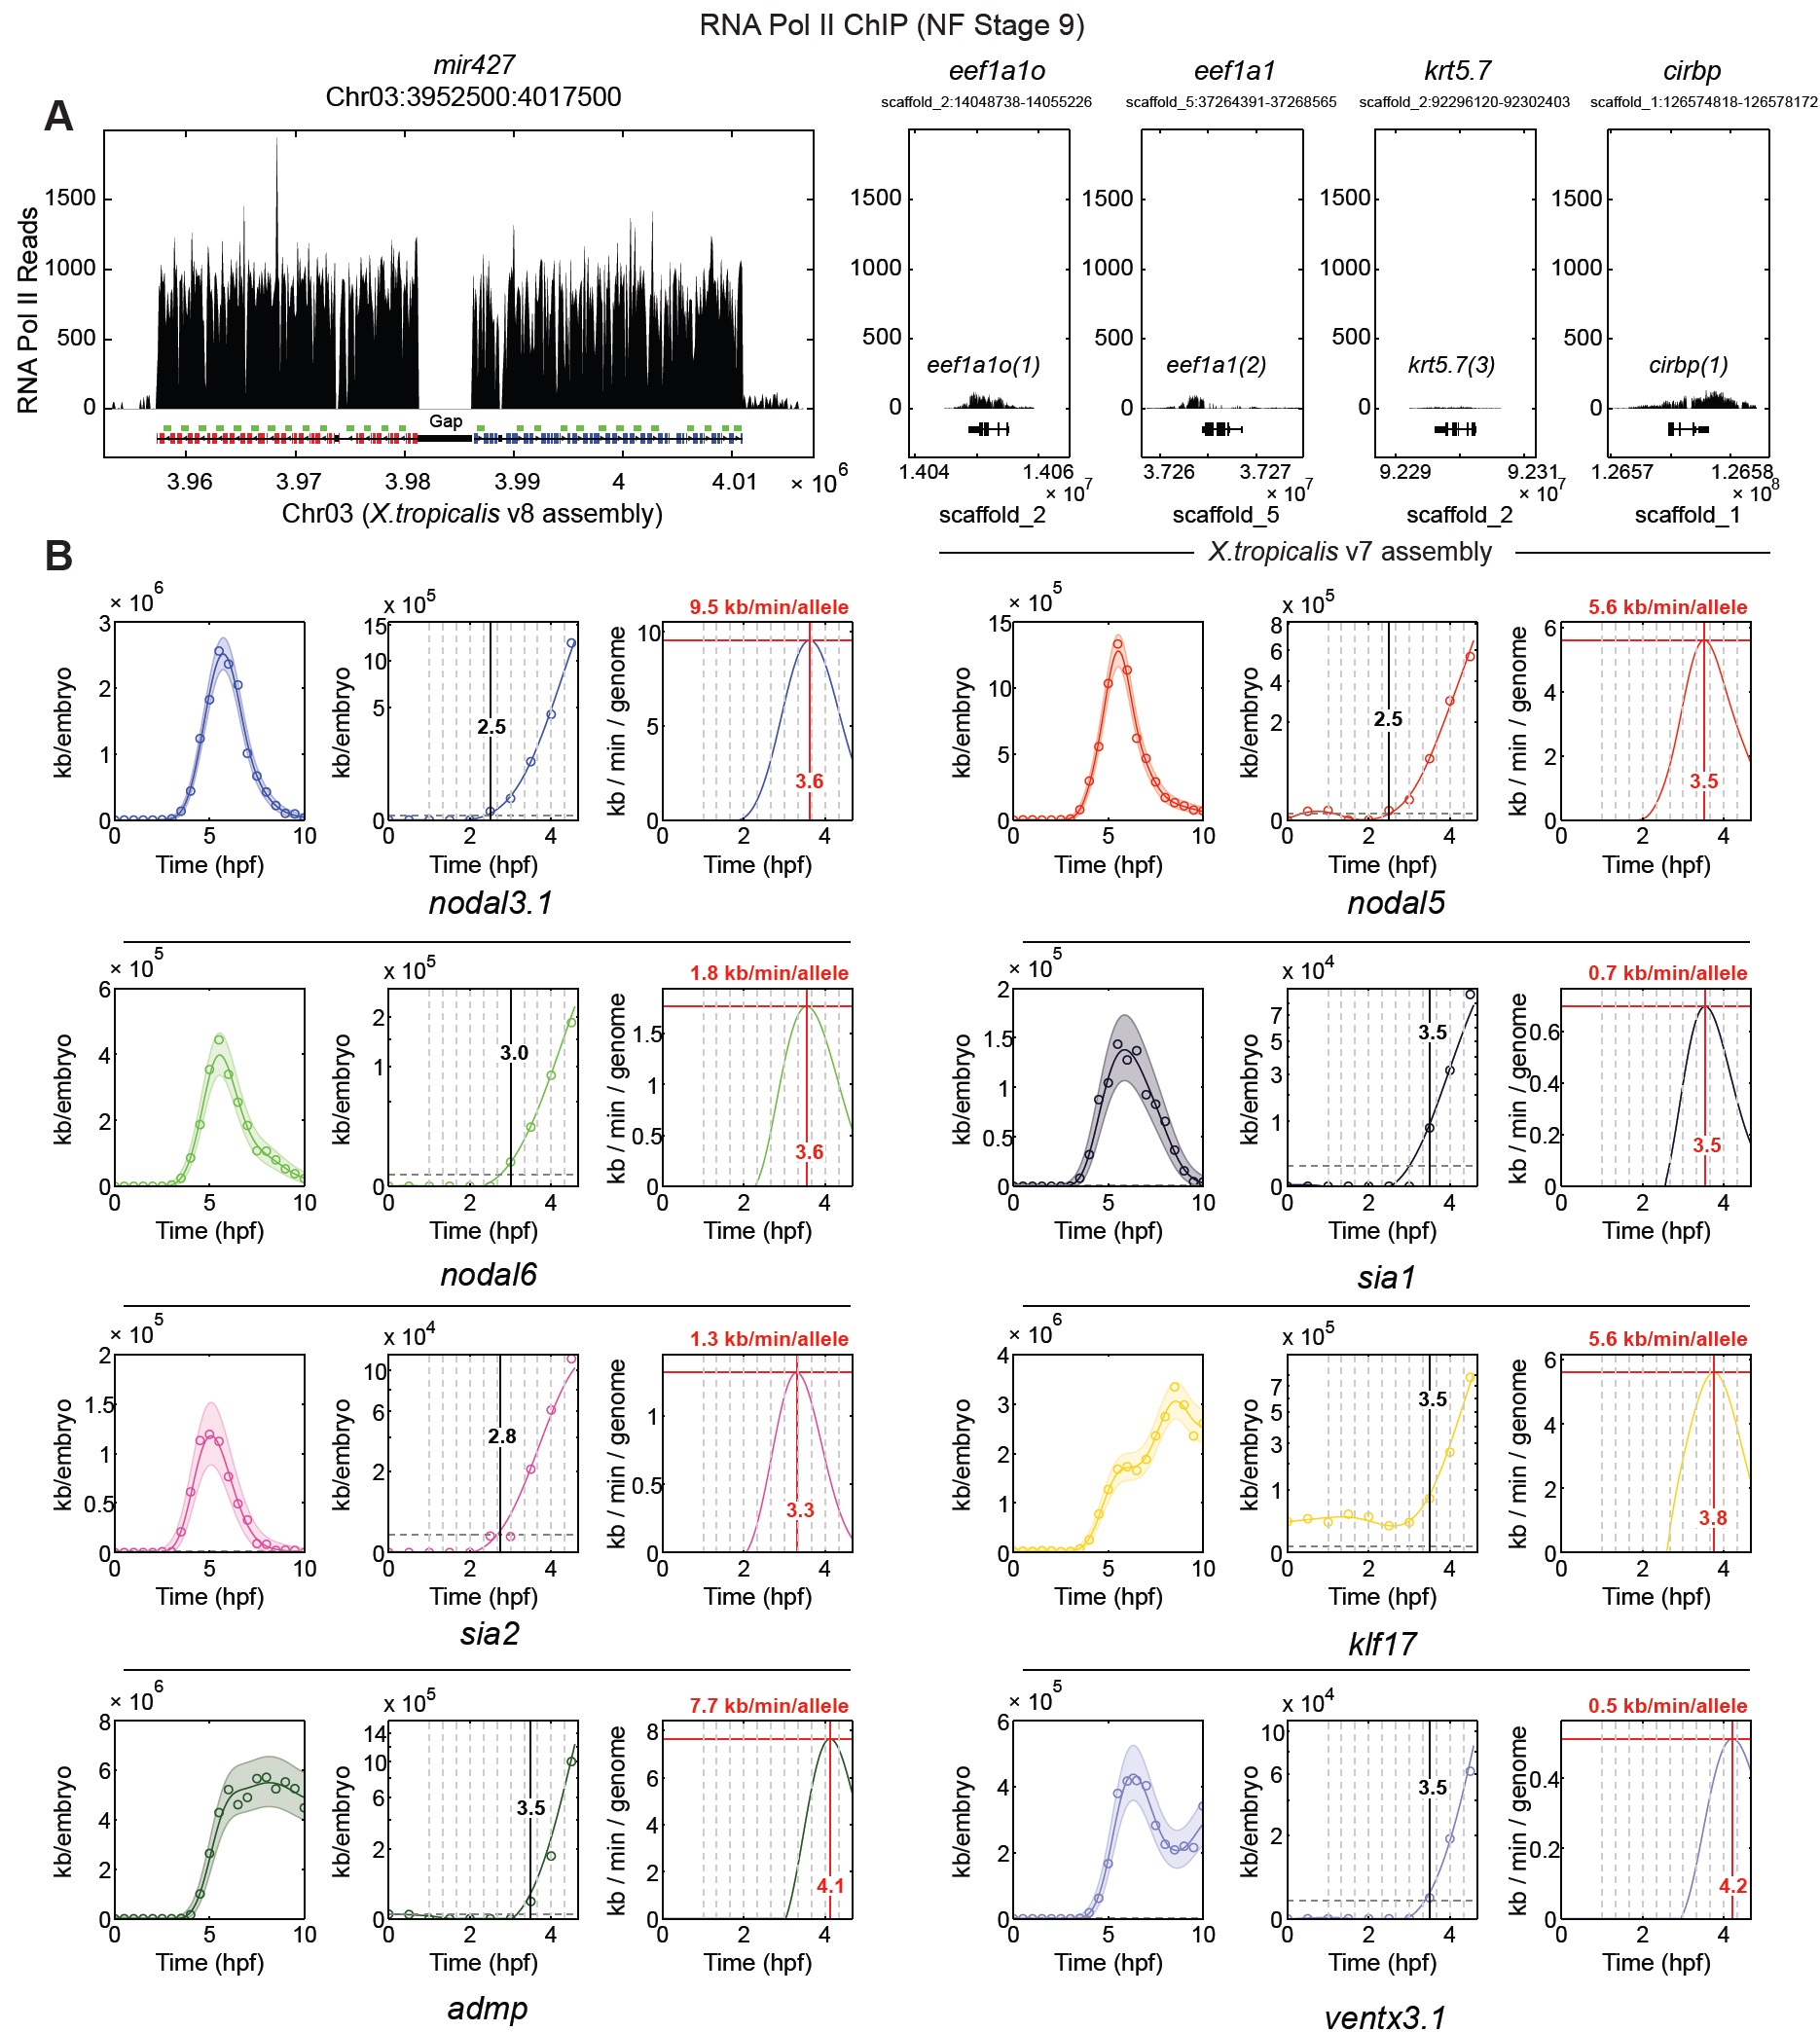
Fig S7 â Early transcription events, related to Fig 6.
(A) Stage 9 RNA pol II ChIP - Pile ups on mir427, eef1a1o, eef1a1, krt5.7 and cirbp loci of RNA pol II ChIP-seq reads (van
Heeringen et al., 2014). See Supplemental Experimental Procedures for calculation of mir427 pile up.
(B) Accumulation rates in kb/min/allele averaged over all cells in the embryo â for nodal3, nodal5, nodal6, sia1, sia2, klf17,
admp and ventx3.1. Left column: kb/embryo. Center column: Detection of activation of each gene during the cleavage stages.
Note square root vertical scale. Vertical gray dashed lines indicate cell divisions. Horizontal dashed line gives average detection
limit of 970kb for the cleavage stages. Right column: Accumulation rate in kb/min/allele, rates account for exponential increase
in cell numbers and are correct if each transcript were transcribed in all cells (Supplemental Experimental Procedures). Image published in: Owens ND et al. (2016) Copyright © 2016. Image reproduced with permission of the Publisher and the copyright holder. This is an Open Access article distributed under the terms of the Creative Commons Attribution License. Larger Image Printer Friendly View |
