XB-IMG-150108
Xenbase Image ID: 150108
|
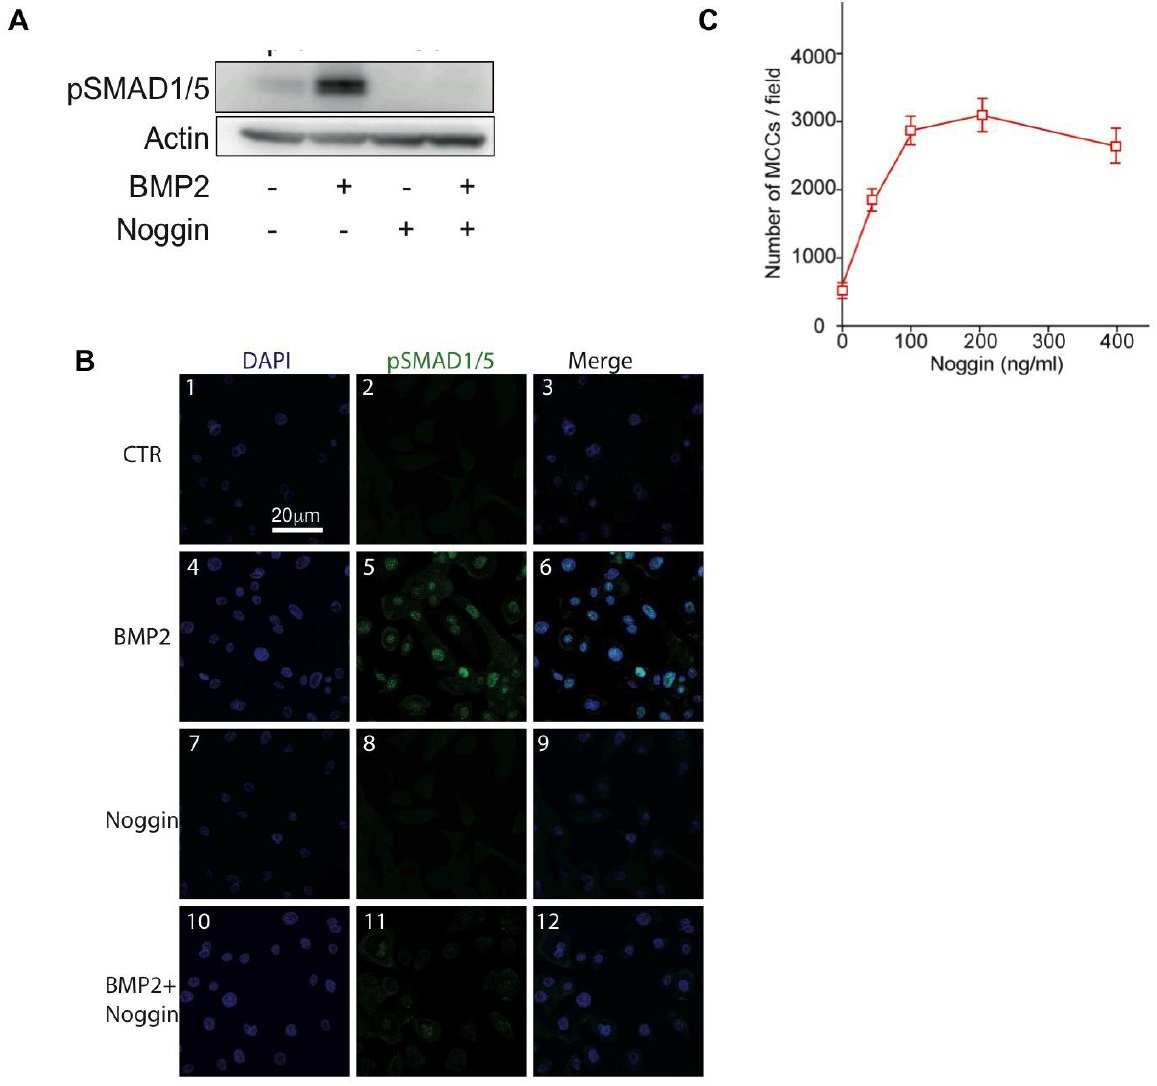
Figure S3: Validation of BMP pathway manipulation in HAECs.
(A): Expression levels of pSMAD1/5 in response to BMP2 (100ng/ml, 2h), Noggin (100ng/ml, 2h), or BMP2+Noggin (100ng/ml each, 2h) in proliferating HAECs. Actin was used as a loading control. (B) Proliferating HAECs were stained to identify the specific sub-cellular localization of pSMAD1/5 (in green) in untreated control cells (panels 1-3), BMP2-treated cells (100ng/ml, 2h) (panels 4-6), Noggin-treated cells (100ng/ml, 2h) (panels 7-9) and cells treated with both BMP2 and Noggin (100ng/ml each, 2h) (panels 10-12). Nuclei were stained with DAPI (in blue; panels 1,4,7,10). Data are representative of 3 independent experiments. (C): Dose-response curve of Noggin treatment. Regenerating HAECs were chronically treated with different doses of recombinant Noggin. Acetylated-tubulin positive MCCs were counted at LC. 100ng/ml Noggin was the minimal dose to give the maximal effect and used in the rest of the study. Image published in: Cibois M et al. (2015) Copyright © 2015. Image reproduced with permission of the Publisher. Larger Image Printer Friendly View |