XB-IMG-151274
Xenbase Image ID: 151274
|
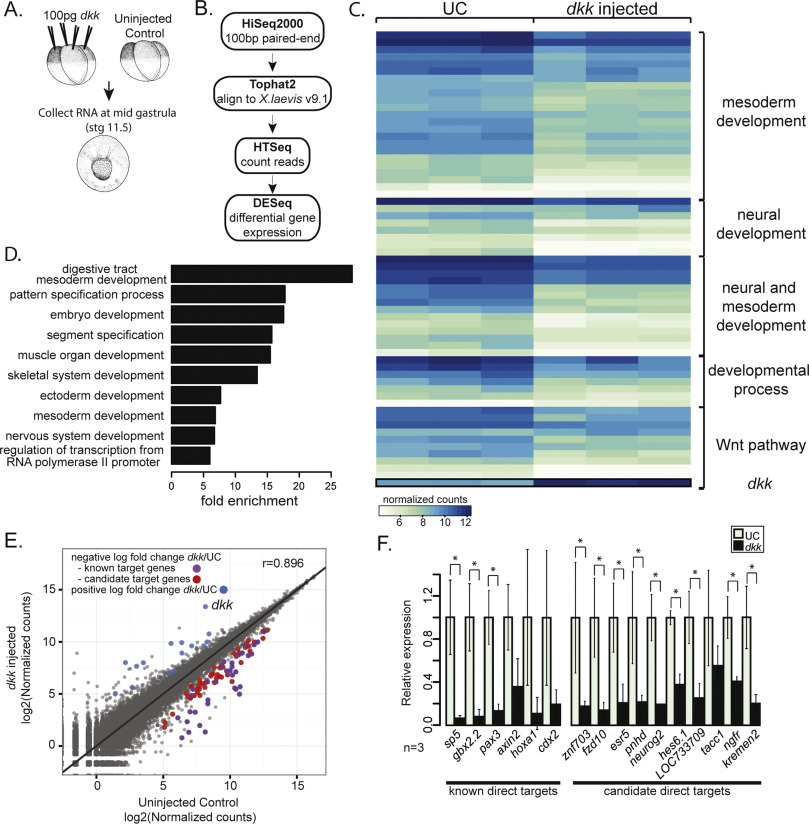
Fig. 1. Expression screen for transcriptional targets of Wnt signaling during gastrulation. (A) Schematic of experiment. 100 pg dkk was injected animally into all blastomeres of 4-cell staged X. laevis embryos. mRNA was extracted from single embryos at stage 11.5 (mid gastrula) and used to make Illumina TruSeq RNA sequencing libraries. (B) Schematic pipeline of RNAseq analysis. (C) Heat map of normalized counts for differentially expressed (DE) genes between three single uninjected control (UC) and three dkk-injected embryos grouped based on categories from GO analysis. (D) Differentially expressed genes were analyzed for enrichment of PANTHER GOslim terms. Fold enrichment is expressed as the observed fraction of genes in GO term category divided by the expected fraction of genes in GO term category. (E) log 2 of normalized counts plotted. Uninjected control (UC) counts on the x-axis and dkk-injected counts on the y-axis. Blue dots have a significant (p-adjusted≤0.05) positive log 2 fold change in dkk-injected embryos, purple and red dots have a significant negative log 2 fold change in dkk-injected embryos. The purple dots are known direct target genes of Wnt signaling and the red dots are candidate target genes of Wnt signaling. (F) qPCR data from single embryos in 3 independent experiments validating selected known and candidate target genes (n=3). Error bars indicate standard deviation and significance was calculated by Student's t-test (*p<0.05). Image published in: Kjolby RAS and Harland RM (2017) Copyright © 2017. Image reproduced with permission of the Publisher, Elsevier B. V. Larger Image Printer Friendly View |