XB-IMG-151517
Xenbase Image ID: 151517
|
|
Figure 9.
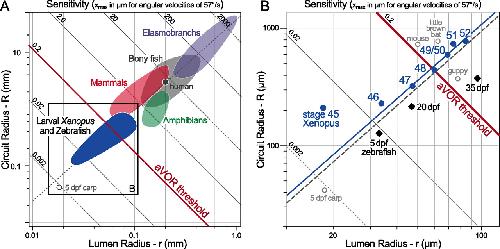
Plots of mean canal lumen radius (r) versus mean canal circuit radius (R) of the horizontal canals of larval Xenopus and zebrafish. A, Superimposed are canal dimensions for selected classes of vertebrates adapted from the study by Muller (1999). Oblique lines represent theoretical endolymph displacement in micrometers for a given angular velocity (1 radian/s or 57.3°/s) and the dashed gray line is the regression line of r = 38.9 × r1.60 all as calculated by Muller (1999). B, The solid blue line is the regression line of r = 42.2 × r1.59 for stage 47–52 larvae. Measurements for the horizontal canal lumen and circuit radii for larval zebrafish and mouse are from previous studies [5, 20 dpf (Bever and Fekete, 2002); 35 dpf and behavior (Beck et al., 2004b); mouse (Calabrese and Hullar, 2006)]. The mouse lumen radius is shown at its smallest estimated size. For stage 48 Xenopus, the horizontal aVOR rises above threshold for the first time and becomes fully active at stage 49. Based on the behavioral response of Xenopus and zebrafish larvae, the oblique solid red line is a generalized sensitivity threshold for vertebrate aVOR behavior for this stimulus. Image published in: Lambert FM et al. (2008) Copyright © 2008. This image is reproduced with permission of the publisher and the copyright holder. This is an Open Access article distributed under the terms of the Creative Commons Attribution License. Larger Image Printer Friendly View |