XB-IMG-151522
Xenbase Image ID: 151522
|
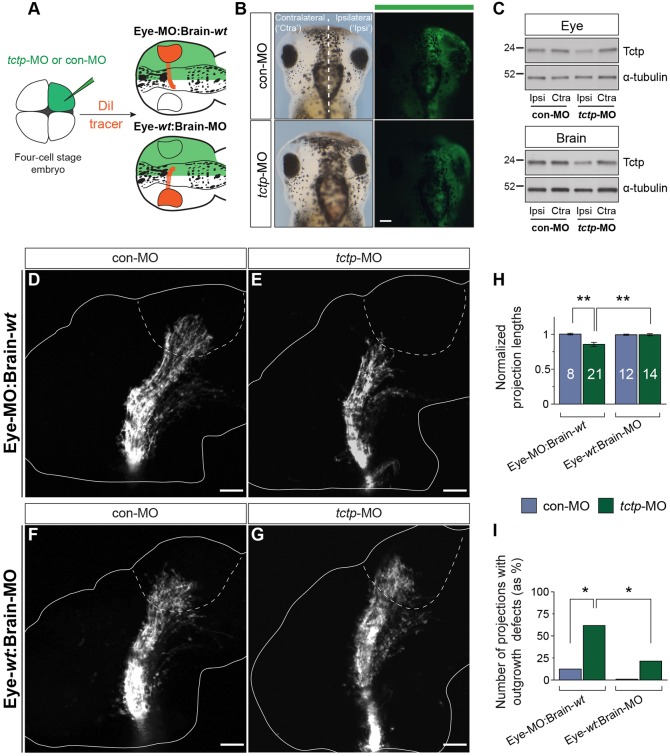
Fig. 5. The retinotectal projection develops unerringly in Tctp-deficient brains. (A) Experimental outline illustrating the two experimental scenarios created to investigate the contribution of extracellular Tctp to the optic tract pathway substrate. (B) Dorsal view of embryos microinjected unilaterally with fluorescein-tagged con-MO or tctp-MO. (C) Unilateral tctp-MO injection leads to a targeted knockdown in Tctp expression in half of the CNS, as shown by immunoblot analysis of eye or brain lysates. The ‘ipsilateral’ label refers to the MO-injected half of the embryo; the uninjected half is designated ‘contralateral’. (D-G) DiI-filled stage 40 retinotectal projections. Dashed lines approximate the boundary of the optic tectum. (H) Relative projection lengths. Mean±s.e.m.; n, number of brains analysed; **P=0.0002, Kruskal–Wallis and Dunn's multiple comparison test (for details of statistics see Fig. S2F). (I) Number of brains displaying axon extension defects. Eye-MO:Brain-wt backgrounds, *P=0.0352; tctp-MO backgrounds, *P=0.0364; Fisher's exact test; analyses performed on frequencies but plotted as percentage. Scale bars: 100 μm. Image published in: Roque CG et al. (2016) © 2016. This image is reproduced with permission of the journal and the copyright holder. This is an open-access article distributed under the terms of the Creative Commons Attribution license Larger Image Printer Friendly View |