XB-IMG-151530
Xenbase Image ID: 151530
|
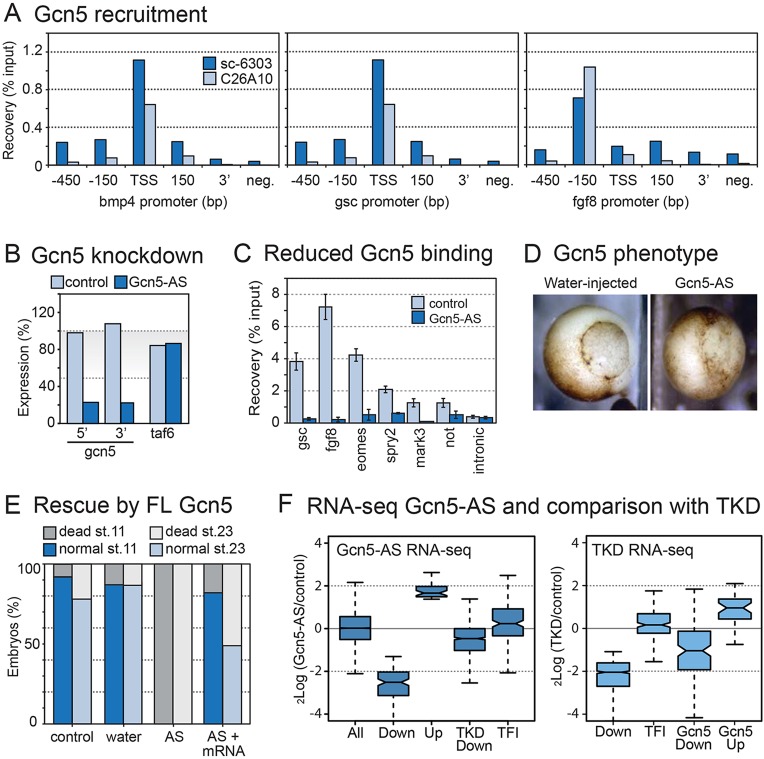
Fig. 4. Analysis of Gcn5 function in early embryos. A number of TFI genes recruit Gcn5 to their promoter and require Gcn5 for normal expression. (A) Gcn5 binding at different regions around the transcription start site (TSS) of bmp4, gsc and fgf8 genes in X. tropicalis. ChIP was performed using two different polyclonal anti-GCN5 antibodies. Negative controls (3′ ends of genes and an intergenic region) are indicated. One of the antibodies (C26A10) is highly specific for Gcn5 in western blotting (cf. Fig. S2B). In addition, ChIP signals are reduced in Gcn5-AS-injected embryos (cf. panel C). (B) Depletion of gcn5 transcripts was verified by RT-qPCR. Expression levels normalized by maternal gapdh levels were determined for both 5′ and 3′ regions of the gcn5 mRNA and compared with a control, taf6. (C) Binding of Gcn5 protein to X. laevis promoters is reduced upon gcn5 knockdown, as assessed by ChIP-qPCR using anti-GCN5 C26A10 antibody in control (light blue) and Gcn5-knockdown (dark blue) embryos (stage 10.5). (D) Morphology of control (water-injected) and Gcn5-knockdown (KD, Gcn5-AS injected) embryos showing gastrulation defects at stage 10.5-11. (E) Statistics of rescue experiments performed by co-injecting in vitro-transcribed full-length human GCN5 mRNA (FL Gcn5) together with Gcn5-AS oligos to restore normal development (cf. Fig. S2). Statistics of three independent experiments are summarized. (F) Box plots showing fold change (log2) of transcript levels in duplicate samples of Gcn5-KD and control embryos (left panel), shown for all expressed genes, genes with decreased (Down) and increased (Up) transcripts (DEseq FDR 0.1), genes with decreased transcripts in TKD embryos and TFI genes. Right panel shows reciprocal analysis for TKD conditions. The fold changes are depicted in subsets of genes, decreased transcripts in TKD embryos (Down), TFI genes, transcripts that are decreased (Gcn5 Down) or increased (Gcn5 Up) in Gcn5-AS embryos. Image published in: Gazdag E et al. (2016) © 2016. Creative Commons Attribution license Larger Image Printer Friendly View |