XB-IMG-152802
Xenbase Image ID: 152802
|
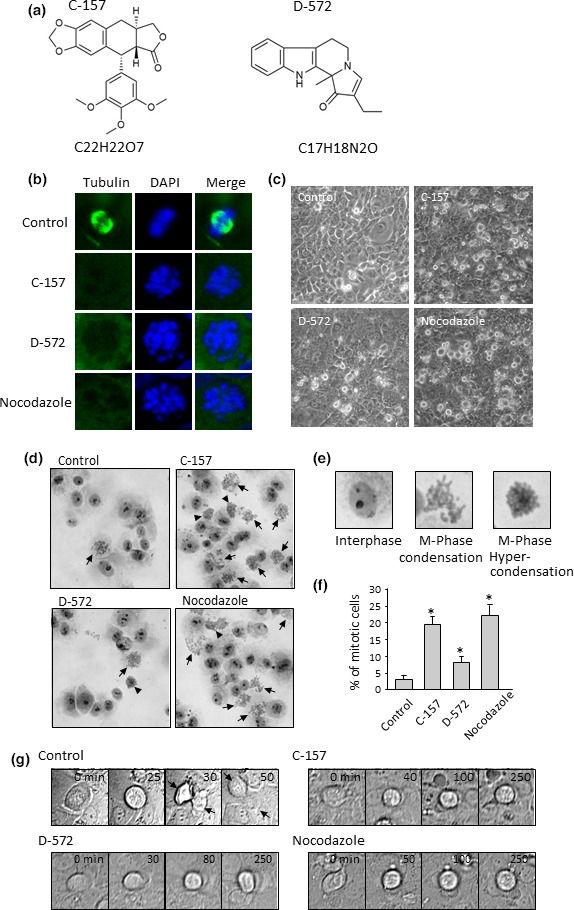
Figure 4. C‐157 and D‐572 cause mitotic defect in SAS cells. (a) The structure of C‐157 and D‐572. (b–f) All experiments were observed at 15 h after addition of C‐157 and D‐572 (10 μM, each) or nocodazole (2 μM). (b) SAS cells were fixed with methanol and stained with α‐tubulin antibody (green). DNA was stained with DAPI (blue). Panels show spindle microtubules in control cells at metaphase and disrupted microtubules in drug‐treated cells at prometaphase. (c) Phase‐contrast microscope images in control and drug‐treated SAS cells. (d) Giemsa staining of control and drug‐treated SAS cells. After addition of each drug, cells were fixed with methanol/acetic acid and then stained by Giemsa solution. Arrows and arrowheads indicate the chromosome condensation and hyper‐condensation in mitotic phase, respectively. (e) Enlargement of interphase or mitotic cells in (d). (f) Frequency (%) of mitotic cells after C‐157 or D‐572 treatment. Mitotic cells were discriminated by the chromosome condensation as shown in (e) by Giemsa staining. *P < 0.05. (g) Live cell imaging of mitosis in SAS cells. Arrows in control cells indicate the daughter cells created by cell division. “Time 0” was defined as the onset of prophase. Image published in: Tanaka M et al. (2016) © 2016 The Authors. This image is reproduced with permission of the journal and the copyright holder. This is an open-access article distributed under the terms of the Creative Commons Attribution-NonCommercial-NoDerivatives license Larger Image Printer Friendly View |