XB-IMG-153329
Xenbase Image ID: 153329

|
|
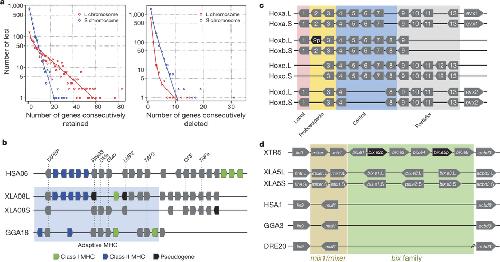
Figure 3. Structural response to allotetraploidya. Distributions of consecutive retentions (left) and deletions (right) in the L (red) and S (blue) subgenomes. The distributions were fit using the equation y= a*(ebx) + c*(edx). The y-axis is shown on a log scale. Significant differences were seen between L and S subgenomes in both distributions (Studentâs t-test, retention p=3.6E-22, deletion p=4.5E-84).b. Evolutionary conservation of the Xenopus MHC and differential MHC silencing on the two X. laevis subgenomes. Selected gene names shown above. The âAdaptive MHCâ encodes tightly-linked essential genes involved in antigen presentation to T cells; this group of genes is the primordial linkage group and has been preserved in most non-mammalian vertebrates, including Xenopus. Differential gene silencing is particularly pronounced as four genes around the class I gene are functional on S chromosome but absent (dma, dmb) or pseudogenes (ring3, lmp2) on L chromosome. The gene map is not to scale; pseudogenes (p) are noted as indicated. HSA, XLA, GGA: human, Xenopus, and chicken MHC, respectively. Refer to the Supplemental Table 8 for a more detailed MHC map.c. Hox gene clusters. X. laevis retains eight Hox clusters, consisting of pairs of HoxA, B, C and D clusters, on L and S chromosomes. even-skipped genes (evx1 or evx2) are positioned flanking Hoxa and Hoxd clusters. hox genes are classified into four, labial, proboscipedia, central, and posterior groups. Note that hoxb2.L (black) is a pseudogene.d. Syntenies around the mix gene family. Abbreviations for species and chromosome numbers: human (H. sapiens; HSA1), chicken (G. gallus; GGA3), X. tropicalis (XTR5), X. laevis (XLA5L and XLA5S), zebrafish (D. rerio; DRE20). Each Xenopus (sub)genome experienced its own independent expansion of the family (see Extended Data Fig. 5 for details). Image published in: Session AM et al. (2016) Image downloaded from an Open Access article in PubMed Central. Image reproduced on Xenbase with permission of the publisher and the copyright holder. Larger Image Printer Friendly View |
