XB-IMG-154019
Xenbase Image ID: 154019
|
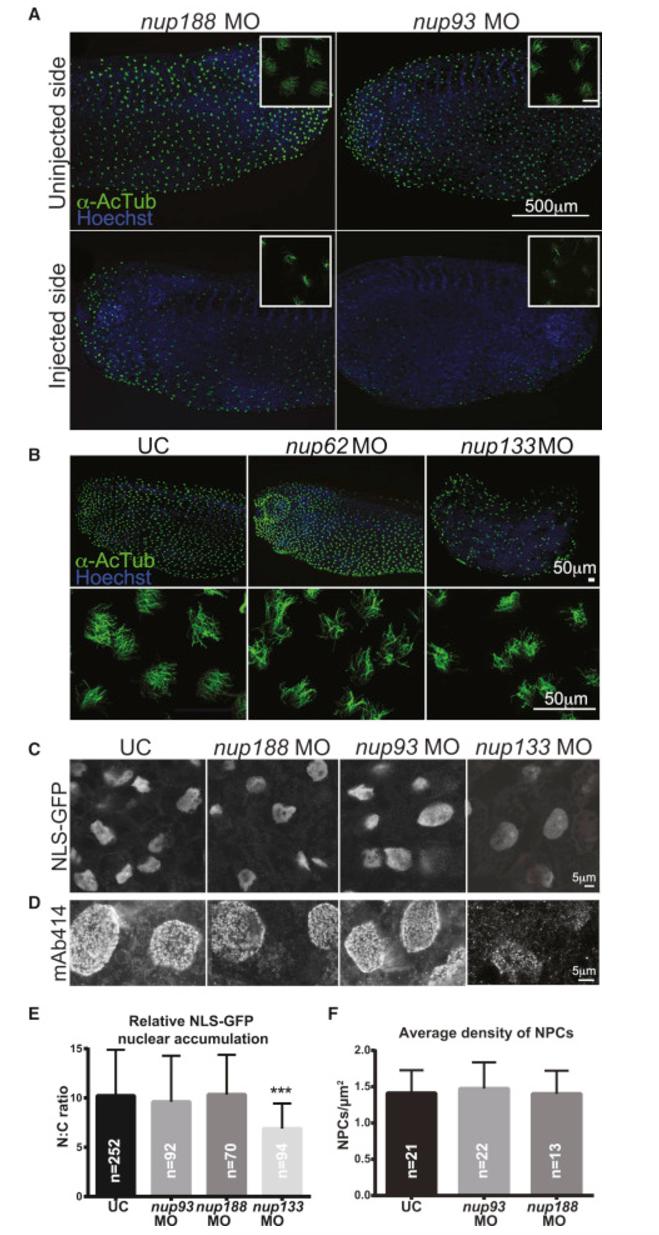
Figure 3.
Depletion of Nup93/188 Affects Cilia but Not NPCs
(A) Fluorescence images of lateral views, with dorsal at the top, of both sides (uninjected and injected) of a single embryo with the cilia of the multiciliated cells (MCCs) labeled with α-AcTub (green). Nuclei stained with Hoechst (blue). Insets (top right) are a magnification of a cluster of MCCs (scale bar, 20 μm). The disruption of cilia was found in 100% (n = 73) of nup93 morphants and in 41% (n = 70) of nup188 morphants.
(B) Fluorescence images of Xenopus embryos injected with nup62 (n = 30) or nup133 (n = 33) MOs at the 1-cell stage labeled with anti-AcTub (green). Lateral views of embryos, with dorsal at the top (top panels) and higher magnification of the MCCs in the bottom panels. Nuclei stained with Hoechst (blue). Level of nup depletion in these morphants is shown in Figure S1A.
(C) Embryos were co-injected with mRNA encoding NLS-GFP and nup93, nup188, or nup133 MOs. Animal caps were dissected and allowed to develop MCCs before imaging the distribution of NLS-GFP. Cilia in these explants are shown in Figure S1J.
(D) Staining of NPCs with the mAb414 antibody in animal caps of UC and embryos injected with the indicated MOs.
(E) Graph shows the mean nuclear/cytoplasm (N:C) fluorescence ratios of NLS-GFP with SD; n represents total number of nuclei from three independent experiments. ∗∗∗p < 0.0005, Student’s t test.
(F) Graph shows the mean and SD of the NPC density in animal caps of UCs and embryos injected with the indicated MOs. n represents number of nuclei from three independent experiments.
See also Figures S1 and S2. Image published in: Del Viso F et al. (2016) Copyright © 2016. Image reproduced with permission of the Publisher, Elsevier B. V.
Image source: Published
Larger Image Printer Friendly View |