XB-IMG-154020
Xenbase Image ID: 154020
|
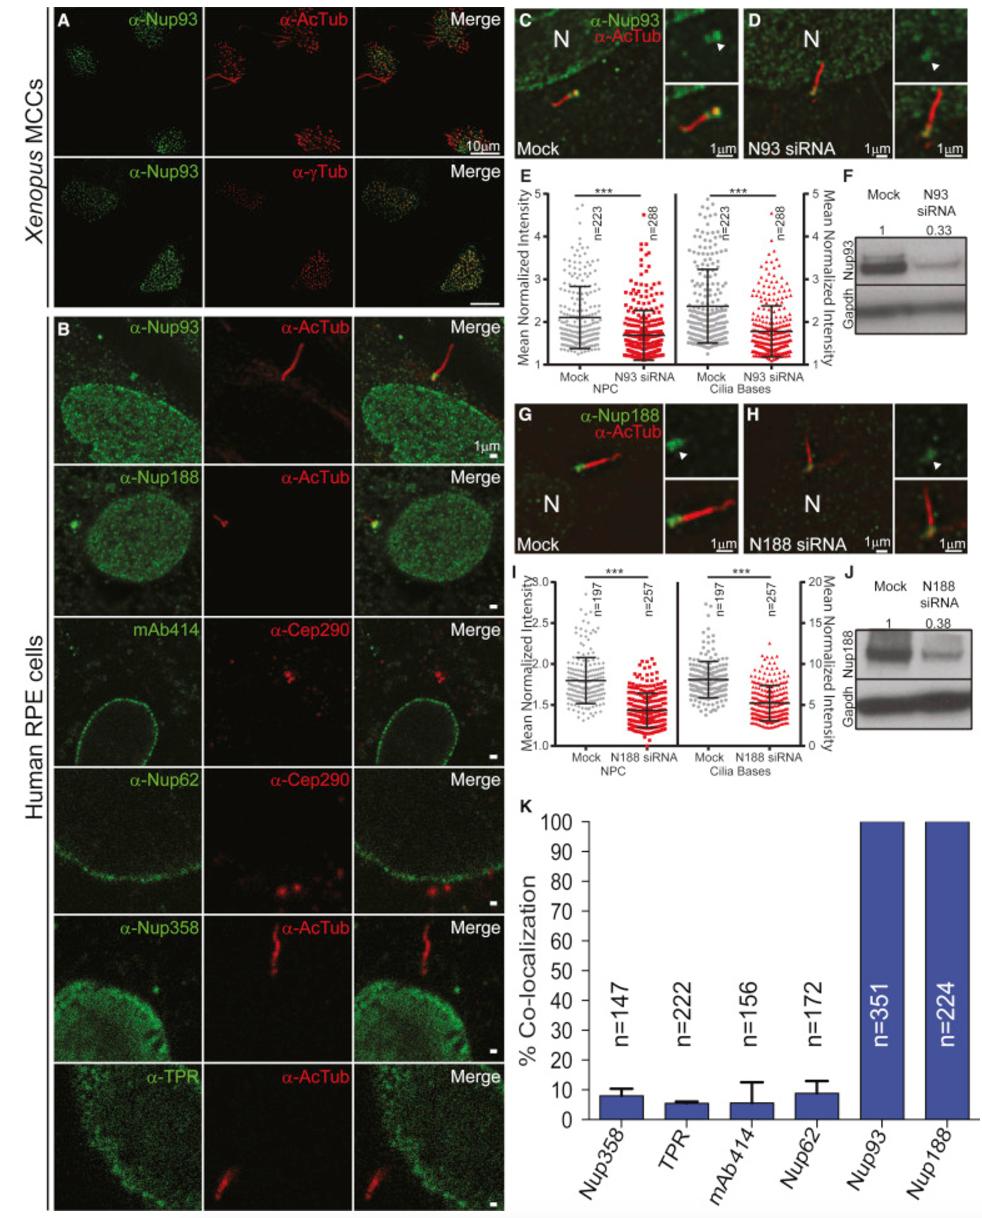
Figure 4.
Nup188 and Nup93 Specifically Localize to the Bases of Cilia
(A) Immunofluorescence images of Xenopus epidermal MCCs stained with anti-Nup93 (green) and either anti-AcTub (red, top) or anti-γTub (red, bottom) antibodies with merge.
(B) Immunofluorescence images of human RPE cells stained with the indicated anti-nup antibodies (left) with anti-AcTub, anti-γTub, or anti-Cep290 (middle) and merge (right). See Figure S3B for location of cilia-specific epitopes.
(C) Anti-Nup93 antibodies are specific. Fluorescence image (merge of green and red channels) of representative scrambled (mock) siRNA-treated RPE cell stained with anti-Nup93 (green) and anti-AcTub (red) antibodies. Panels on right are higher magnification of cilium base showing just the anti-Nup93 signal (green; top) and merge of anti-Nup93 and anti-AcTub (red) images (bottom). Arrowhead points to cilium base. N denotes the nucleus.
(D) Identical to (C) except that cells are treated with siRNAs specific to NUP93 (N93).
(E) Plot of normalized fluorescence intensity in a.u. of anti-Nup93 signal at cilium base and NPCs of individual cells treated with scrambled (mock) or specific NUP93 (N93) siRNAs. Mean ± SD is indicated; n represents total number of cells/cilia from three independent experiments. âââp < 0.0005, Studentâs t test.
(F) Western blot of Nup93 levels after siRNA transfection; numbers are quantification of protein levels relative to Gapdh.
(GâJ) Anti-Nup188 antibodies are specific. Panel layout is identical to (C)â(F) except that cells are treated with scrambled (mock) or siRNAs specific to NUP188 (N188).
(K) Plot of percentage of cells in which the anti-nup signal co-localizes with a cilium-base marker. Mean ± SD is indicated; n represents total number of cells from three independent experiments.
See also Figures S1 and S3. Image published in: Del Viso F et al. (2016) Copyright © 2016. Image reproduced with permission of the Publisher, Elsevier B. V.
Image source: Published Larger Image Printer Friendly View |