XB-IMG-154542
Xenbase Image ID: 154542
|
|
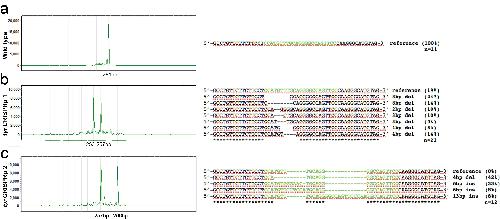
Supplemental Fig. 1. Topo-cloned sequence of deletion and insertion peaks. Green marks the target sequence,-marks deletions or insertions, * marks identical sequence to WT. FA genotype – X-axis=size of amplicon in basepairs (bp), Y-axis=relative intensity of PCR signal to loading control. (a) WT FA peak at 261 bp and corresponding sequence from n=11 clones. (b) Embryo injected with Cas9 protein+tyr sgRNA. FA shows two main peaks at 253 bp and 257 bp, corresponding to 8 bp and 4 bp deletions and their corresponding sequences from n=21 clones. (c) Embryo injected with Cas9 protein+tyr sgRNA. FA shows two main peaks at 257 bp and 266 bp, corresponding to 4 bp deletion and 5 bp insertion and their corresponding sequences from n=12 clones. Image published in: Bhattacharya D et al. (2015) Copyright © 2015. Image reproduced with permission of the Publisher, Elsevier B. V. Larger Image Printer Friendly View |