XB-IMG-154547
Xenbase Image ID: 154547
|
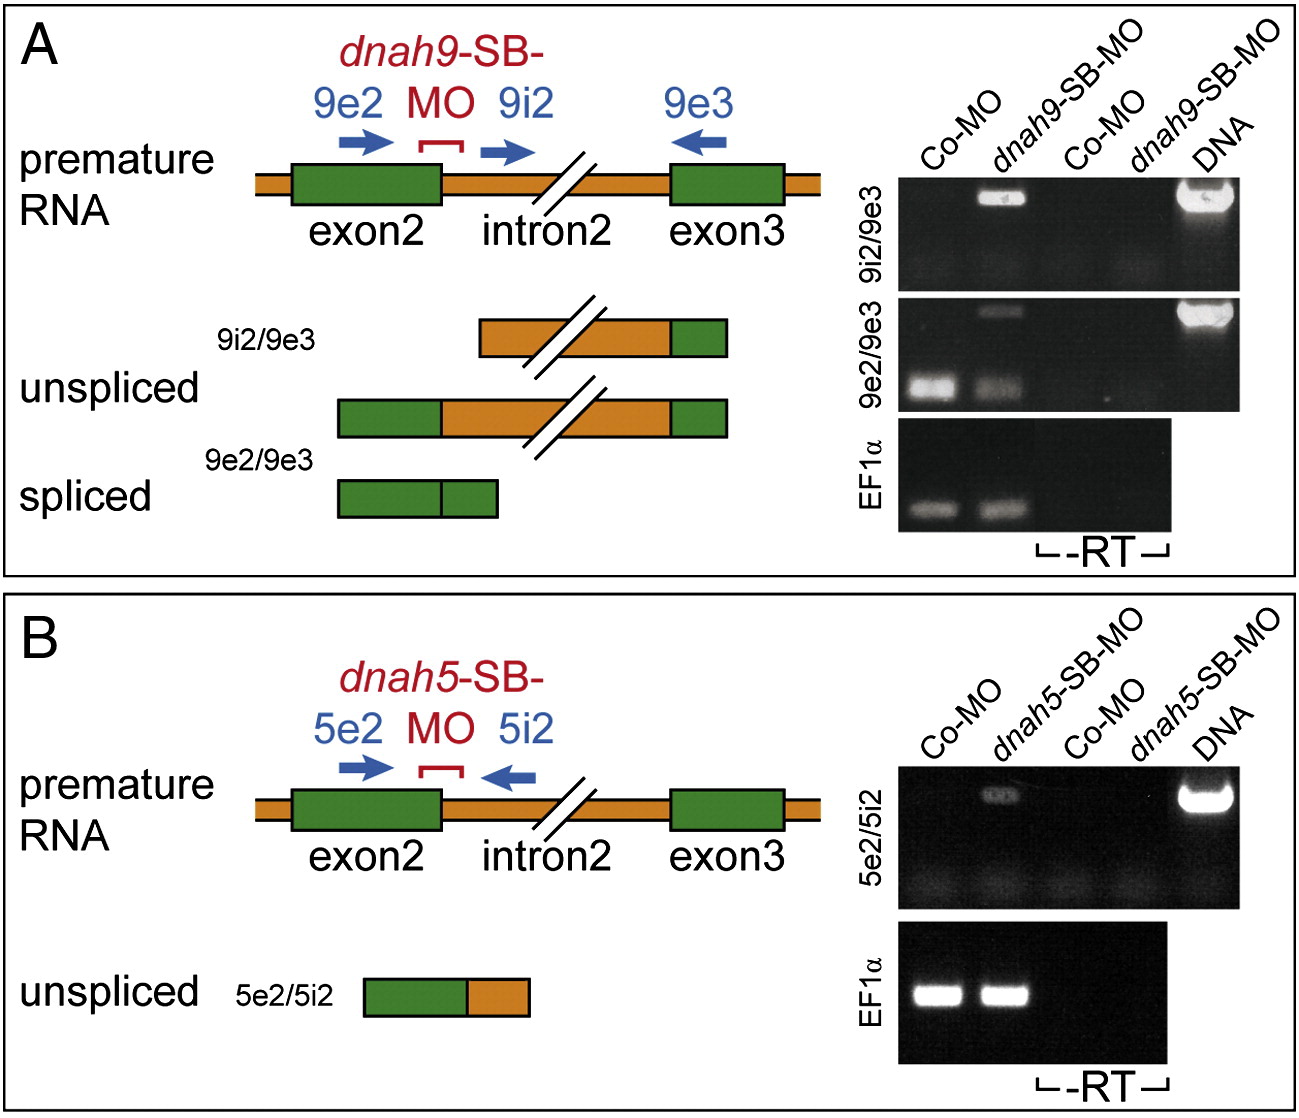
Suppl. Fig. 4.
(A) Inhibition of intron2 splicing by dnah9-SB-MO. RT-PCR analysis of MO-injected embryos. Splicing was analyzed using forward primer 9e2 (located in exon 2) or forward primer 9i2 (located in intron 2), and reverse primer 9e3 (located in exon 3), schematically indicated by green (exons) and orange (intron) bars, and by blue arrows (primers). PCR of genomic DNA resulted in 1.5 kb (9e2–-9e3) and 1.4 kb (9i2–-9e3) bands. RT-PCR of Co-MO inMO-injected specimens yielded no band with 9i2–-9e3, and a strong band of 225 bp with 9e2–-9e3, corresponding to the joined exons. In dnah9-MO-injected embryos, bands representing unspliced RNAs were observed with both 9e2–-9e3 and 9i2–-9e3, while the spliced band observed with 9e2–-9e3 was much reduced compared to Co-MO-injected samples (cf. EF1 alpha loading control). No products were amplified without prior RT reaction (− -RT). (B) Inhibition of intron2 splicing by dnah5-SB-MO. RT-PCR analysis of MO-injected embryos. Splicing was analyzed using forward primer 5e2 (located in exon 2) and reverse primer 5i2 (located in intron 2), schematically indicated by green (exons) and orange (intron) bars, and by blue arrows (primers). PCR of genomic DNA resulted in 600 bp (5e2–-5i2) band. RT-PCR of Co-MO inMO-injected specimens yielded no band with 5e2–-5i2. In dnah5-SB-MO-injected embryos, a band representing unspliced RNA was observed with 5i2–-5e3 (cf. EF1 alpha loading control). No products were amplified without prior RT reaction (− -RT). Image published in: Vick P et al. (2009) Copyright © 2009. Image reproduced with permission of the Publisher, Elsevier B. V. Larger Image Printer Friendly View |