XB-IMG-155163
Xenbase Image ID: 155163
|
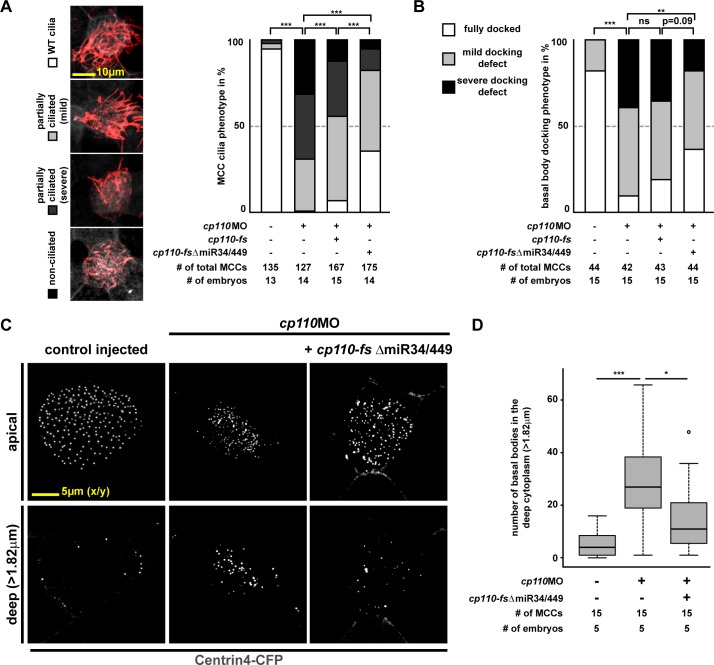
Figure 1—figure supplement 2. Quantification of basal body and ciliogenesis phenotypes in MCCs.(A) Quantification of MCC ciliogenesis phenotypes. Color code as indicated in images on the left. ***p<0.001 from χ²-test. Related to Figure 1D. (B–D ) Quantification of basal body phenotypes. (B) Color code as indicated in lateral projection images in Figure 1E. ***p<0.001; **p<0.01; ns, p>0.05 from χ²-test. Related to Figure 1E. (C–D) Representative examples of apically localized and cytoplasmic basal bodies (C) as used for quantification (D) of basal bodies in the deep cytoplasm (>1.82 μm below apical membrane). Samples are derived from one representative experiment included in (B).DOI:
http://dx.doi.org/10.7554/eLife.17557.004 Image published in: Walentek P et al. (2016) © 2016, Walentek et al. This image is reproduced with permission of the journal and the copyright holder. This is an open-access article distributed under the terms of the Creative Commons Attribution license Larger Image Printer Friendly View |