XB-IMG-155555
Xenbase Image ID: 155555
|
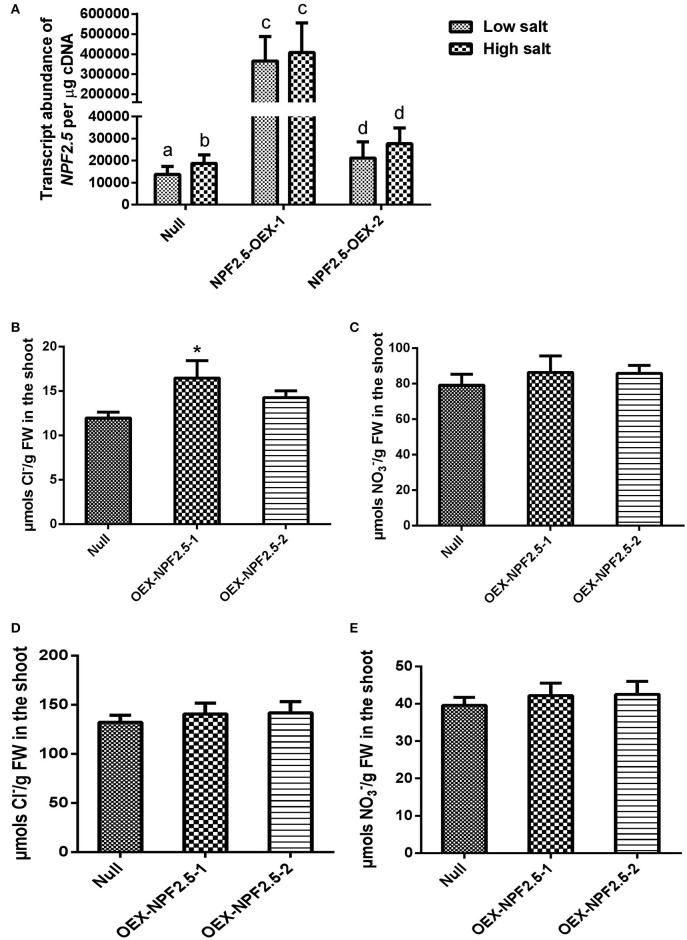
Figure 8. NPF2.5 over-expression lines treated with low/high salt. Four-week old hydroponically grown T3
NPF2.5 over-expression lines were treated with 2 mM (low salt) or 75 mM NaCl (high salt) for 5 days before harvest. (A)
NPF2.5 transcript abundance detected in roots of mutant lines and null segregant control plants. Columns with different letters indicate statistically significant difference (P ≤ 0.05). (B) Shoot Cl− accumulation in over-expressing lines and null segregate controls after low salt treatment. (C) Shoot NO3− accumulation in over-expressing lines and null segregate controls after low salt treatment. (D) Shoot Cl− accumulation in over-expressing lines and null segregate controls after high salt treatment. (E) Shoot NO3− accumulation in over-expressing lines and null segregate controls after high salt treatment. Results are presented as mean ± SEM (n = 4); significance is indicated by asterisks (one way ANOVA and Tukey test, *P ≤ 0.05). Image published in: Li B et al. (2016) Copyright © 2017 Li, Qiu, Jayakannan, Xu, Li, Mayo, Tester, Gilliham and Roy. This image is reproduced with permission of the journal and the copyright holder. This is an open-access article distributed under the terms of the Creative Commons Attribution license Larger Image Printer Friendly View |