XB-IMG-156644
Xenbase Image ID: 156644
|
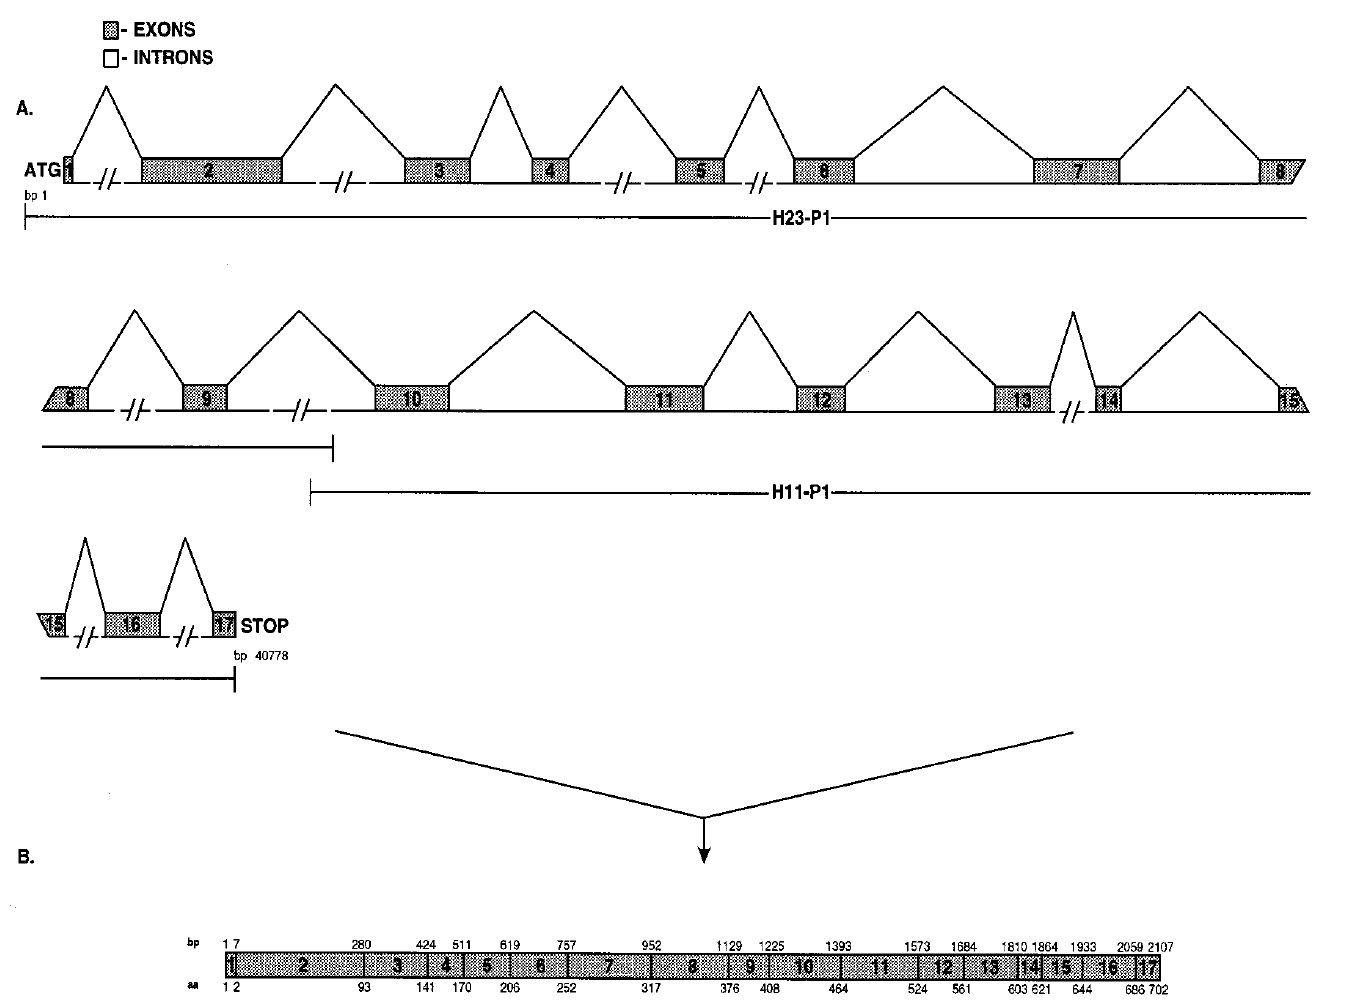
Fig. 2. Genomic organization of the KIF3A gene. (A) The organization of KIF3A was determined by analysis of clones H23-P1
and H11-P1. Exons and introns are drawn to scale, except for introns represented by a hatched line which have been scaled
down. (B) Schematic diagram of KIF3A showing exons only. The nucleotides and corresponding amino acids are numbered as
shown. Image published in: Whitehead JL et al. (1999) Copyright © 1999. This image is reproduced with permission of the publisher and the copyright holder. This is an Open Access article distributed under the terms of the Creative Commons Attribution License. Larger Image Printer Friendly View |