XB-IMG-156668
Xenbase Image ID: 156668
|
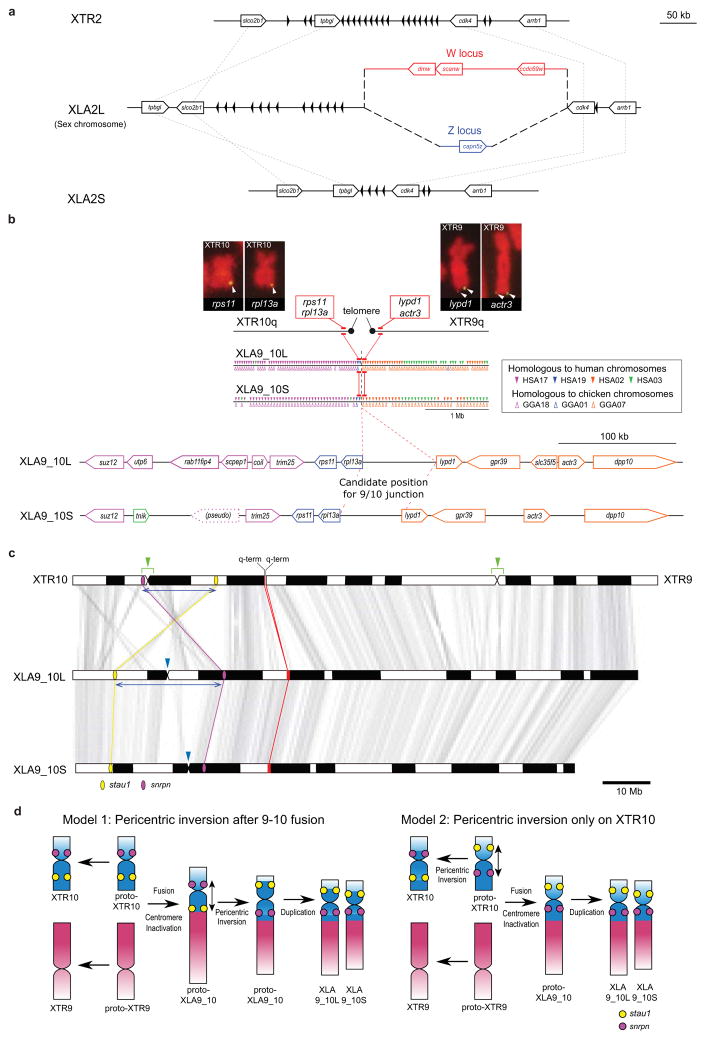
EDF 2. CHROMOSOME STRUCTURE
Structure of the sex chromosome of X. laevis (XLA2L) and comparison with XLA2S and XTR2. The W version of XLA2L harbors W-specific sequence containing the female sex-determining gene, dmw (red), while Z has a different Z-specific sequence (blue). Pentagon arrows and black triangles indicate genes and olfactory receptor genes, respectively. Their tips correspond to their 3â-ends.Alignment of the q-terminal regions of XTR9 and 10 with corresponding regions of XLA9_10L and XLA9_10S. Genes near the q terminal regions of XTR 9 and XTR10 were missing in the X. tropicalis genome assembly v9, but rps11, rpl13a, lypd1, and actr3 were expected to be located there based on the synteny with human chromosomes, and then verified by cDNA FISH (upper panels). Small triangles on XLA9_10L and S indicate the distribution of gene models showing both identity and coverage greater than 30%, against the human and chicken peptide sequences from Ensembl, in the region between ±2 Mb from the prospective 9/10 junction. HSA: human chromosome. GGA: chicken chromosome. The magnified view represents syntenic genes to scale with colors corresponding to human genes.The orders of orthologous genes across XTR9, XTR10, XLA9_10L and XLA9_10S. Green arrowheads: positions of centromeres in XTR9 and 10 predicted by examination of the cytogenetic chromosome length ratio of p versus q arms15. Blue arrowheads: positions of centromere repeats, frog centromeric repeat-162, in XLA9_10L and S. Magenta and yellow ellipses: chromosomal locations of snrpn (magenta) and stau1 (yellow) from X. tropicalis v9 and X. laevis v9.1 assemblies. Red ellipses: chromosomal locations of four genes, rps11, rpl13a, lypd1, and actr3. XTR9 is flipped to facilitate comparison. Blue bidirectional arrows indicate the homologous regions where pericentric inversions may have occurred on proto-chromosomes (see Extended Data Fig. 2d).Schematic representation for the two hypothetical processes of chromosomal rearrangements (fusion and inversion) that occurred between the hypothetical proto-XTR9 and 10 to produce proto-XLA9_10, and eventually XLA9_10L and S. The process of chromosome rearrangements is explained parsimoniously in two different ways (left and right panels), starting from proto-XTR9 and 10. Actual and hypothetical ancestral chromosomal locations of snrpn and stau1 are shown by magenta and yellow circles, respectively. Note that the chromosomal locations of these genes on the proto-XTR10 differ between the two models. Chromosome segments homologous to XTR9 and XTR10 are shown in red and blue, respectively. XTR9 is inverted to facilitate comparison. Bidirectional arrows indicate the regions where pericentric inversions may have occurred. Black arrows indicate the direction of chromosomal evolution. Image published in: Session AM et al. (2016) Image downloaded from an Open Access article in PubMed Central. Image reproduced on Xenbase with permission of the publisher and the copyright holder. Larger Image Printer Friendly View |