XB-IMG-158180
Xenbase Image ID: 158180
|
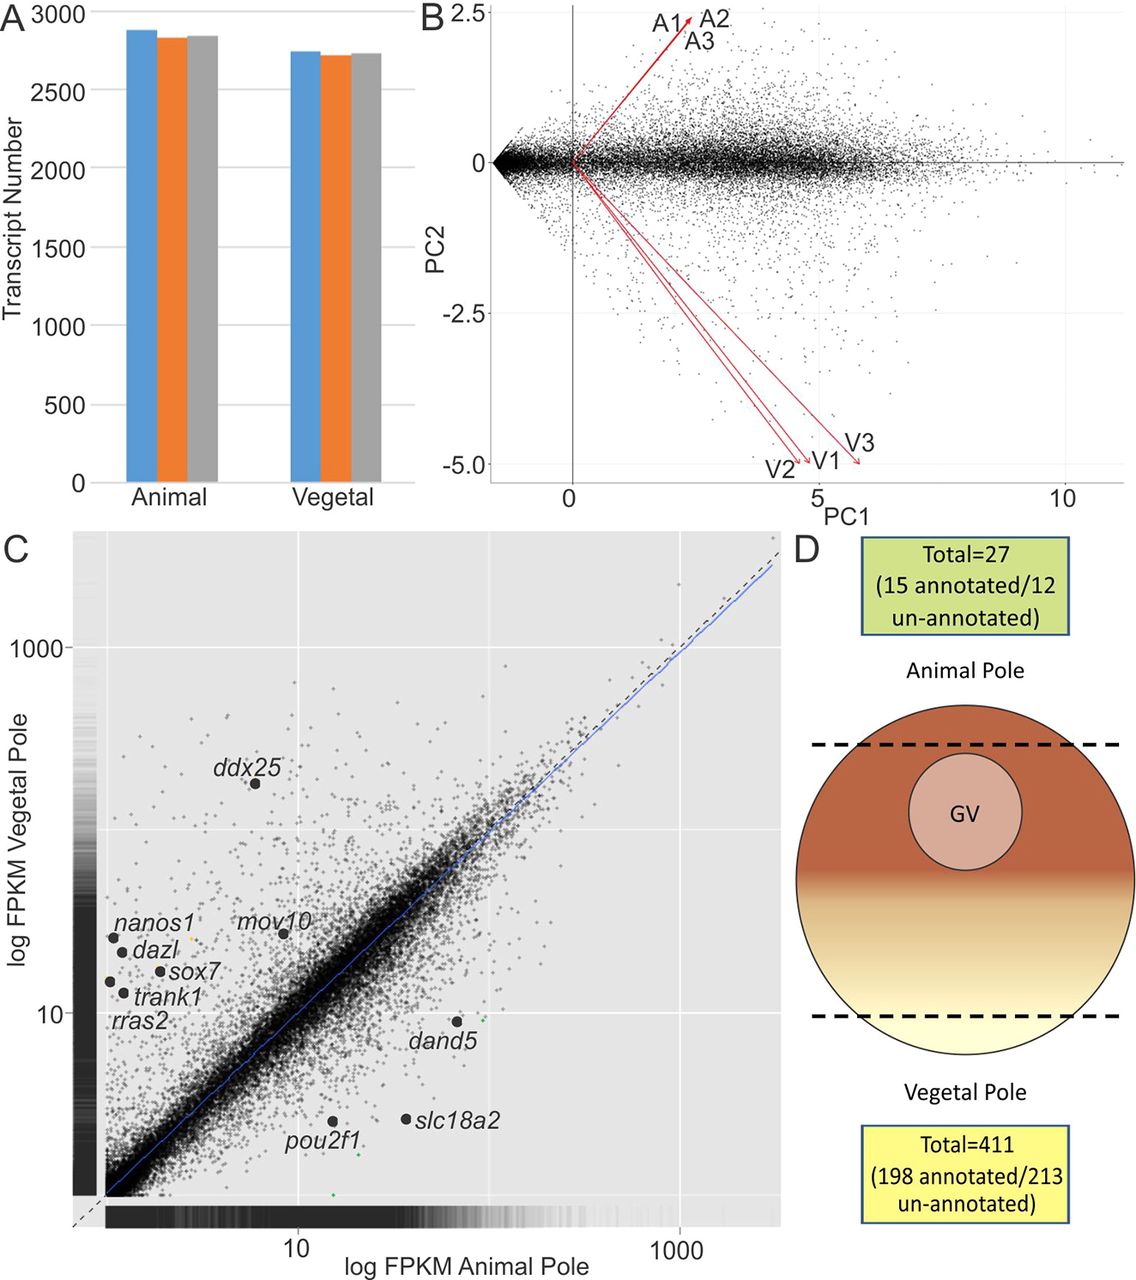
Fig. 1.
RNA-seq analysis of vegetal versus animal pole transcripts in stage VI X. laevis oocytes. (A) Total read counts for oocyte-paired vegetal and animal pole samples. Bars of the same color represent vegetal (n=3) and animal (n=3) pole samples extracted from the same oocytes. (B) Two-dimensional principal component analysis of vegetal and animal pole transcripts. Vectors V1, V2, V3 and A1, A2, A3 represent vegetal and animal pole samples, respectively. (C) Scatter plot comparing vegetal and animal pole transcripts. (D) Differential expression analysis of vegetal versus animal pole transcripts with FDR≤0.05 and FPKM≥5. GV, germinal vesicle. Image published in: Owens DA et al. (2017) Copyright © 2017. Image reproduced with permission of the publisher and the copyright holder. This is an Open Access article distributed under the terms of the Creative Commons Attribution License. Larger Image Printer Friendly View |