XB-IMG-159105
Xenbase Image ID: 159105
|
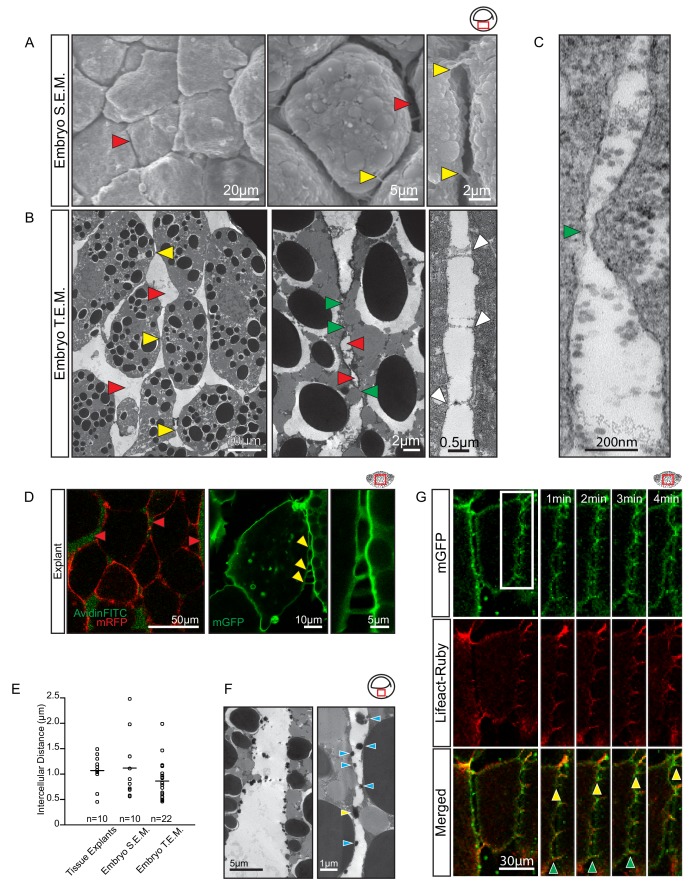
Figure 5. Vegetal endoderm cells migrate through wide interstitial spaces.(A) SEM of endoderm in embryos. Overview (left). High magnification (center) reveals interstitial spaces between cells (red arrows). Cells are linked by stitch contacts (right; yellow arrows). (B) TEM of endoderm in embryos. Overview (left), cell gaps (3- or 4 cell junctions; red arrow) and cell–cell contacts (yellow arrow) are indicated. Higher magnification (center) show contacts (green arrows) interspersed between gaps (red arrows). Base of stitch contacts appear raised (white arrows), indicating tethers are taut (right). (C) A cell-cell contact (green arrow) compatible with cadherin-based adhesion (~30 nm). (D) Interstitial gaps in explants. Labelled (mRFP) explants (left) in medium with AvidinFITC to visualize gaps (red arrows). Stitch contacts (yellow arrows) extend between cells (center). Magnified view of contacts (right). (E) Quantification of intercellular distance in explants, whole embryo SEM, and TEM. Measurements were taken from the central, mid-endodermal region. (F) Interstitial gaps contain extracellular matrix. Putative heteroglycans stained using Alcian Blue appear as black cell surface residues under TEM (blue arrows) or link cells (yellow arrow). Plot shows data cumulatively sampled from four embryos collected from different egg batches. (G) Cells form dynamic intercellular contacts. Membrane label (mGFP; top) and Lifeact-Ruby (middle) co-expressing cells show contacts containing F-actin (merged; bottom). Time-lapse sequence (four right panels) of a region of interest (box) shows that protrusions extend (yellow arrows) and retract (green arrows). Region of interest (red box) is indicated in the top right corner of select panels.10.7554/eLife.27190.017Figure 5—source data 1. Quantification of intercellular distance. Image published in: Wen JW and Winklbauer R (2017) © 2017, Wen et al. This image is reproduced with permission of the journal and the copyright holder. This is an open-access article distributed under the terms of the Creative Commons Attribution license Larger Image Printer Friendly View |