XB-IMG-159352
Xenbase Image ID: 159352
|
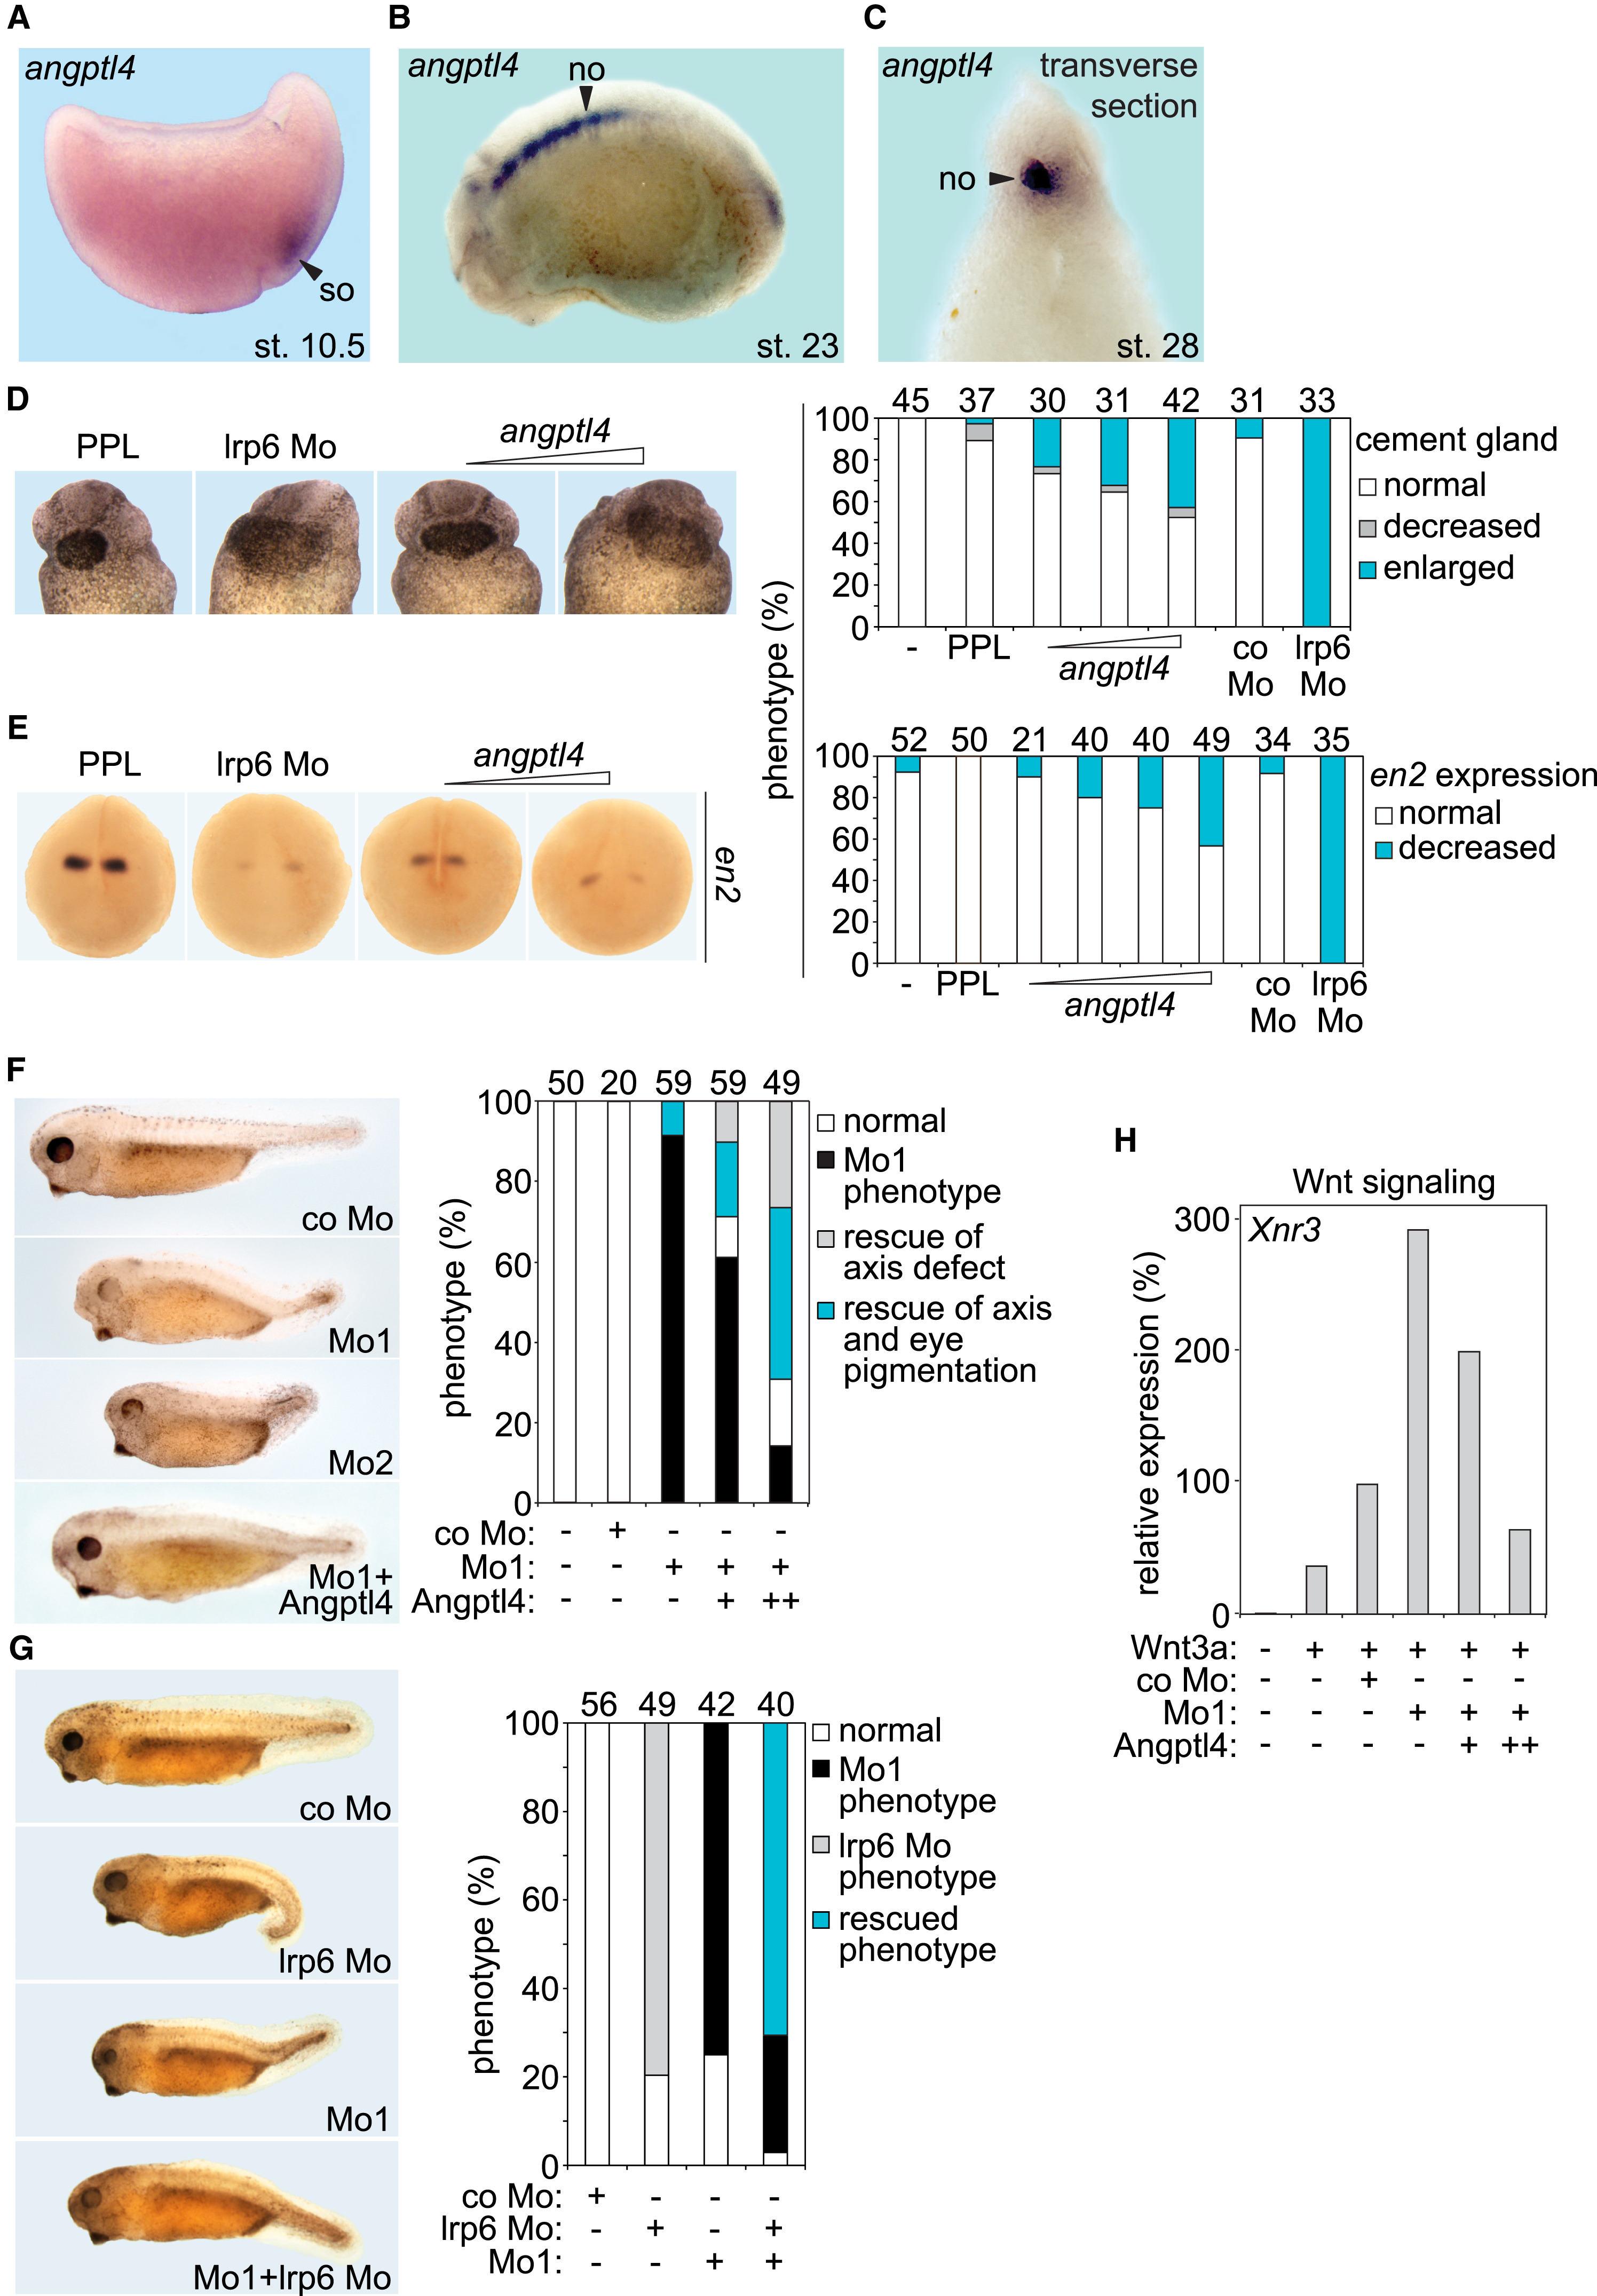
Figure 2. ANGPTL4 Inhibits Wnt Signaling in Xenopus
(A–C) In situ hybridization of angptl4 in Xenopus embryos at gastrula (A, X. laevis, hemisected dorsal to the right), neurula (B, X. tropicalis), and tadpole stage (C, X. tropicalis). Sections (A and C) and whole Xenopus embryos (B) were used. Angptl4 expression was largely restricted to Spemann organizer (so) (A) and notochord (no) (B and C).
(D) Cement gland enlargement of tailbud stage X. laevis embryos injected with lrp6 Morpholino (Mo), angptl4 mRNA, or PPL mRNA. The size of the cement gland was analyzed at tailbud (st.23) stage.
(E) Whole-mount in situ hybridization of engrailed 2 (en2) in X. laevis neurulae. Xenopus embryos were injected with lrp6 Morpholino (Mo), angptl4 mRNA, or PPL mRNA, and en2 mRNA levels were analyzed at neurula (st.18) stage.
(F) Tadpole stage X. tropicalis embryos injected with two different angptl4 antisense or control (co) Morpholinos (Mo). Where indicated, mouse Angptl4 mRNA was co-injected. Phenotypes were quantified at tadpole stage by comparing wild-type and Mo-injected embryo morphology and counting embryos with the indicated abnormalities. Axis defects were defined by shortened trunk-tail structures. Mo phenotype: small head, short axis, wavy tail, reduced eye pigmentation, and melanocytes. The number of embryos per condition is indicated on top of the graph.
(G) Tadpole stage X. tropicalis embryos injected with angptl4 Mo1, lrp6 Mo, or control (co) Mo. Where indicated, angptl4 Mo1 and lrp6 Mo were co-injected.
Phenotypes were quantified at tadpole stage by comparing wild-type and Mo-injected embryo morphology and counting embryos with the indicated abnormalities.
Axis defects were defined by shortened trunk-tail structures.
(H) qRT-PCR analysis of the Wnt target Xnr3 in animal cap explants at early gastrula (st.10+) from X. tropicalis embryos injected with the indicated constructs.
Data show one representative of multiple independent experiments with at least three biological replicates. See also Figure S2. Image published in: Kirsch N et al. (2017) Copyright © 2017. Image reproduced with permission of the Publisher, Elsevier B. V.
Image source: Published Larger Image Printer Friendly View |