XB-IMG-159460
Xenbase Image ID: 159460
|
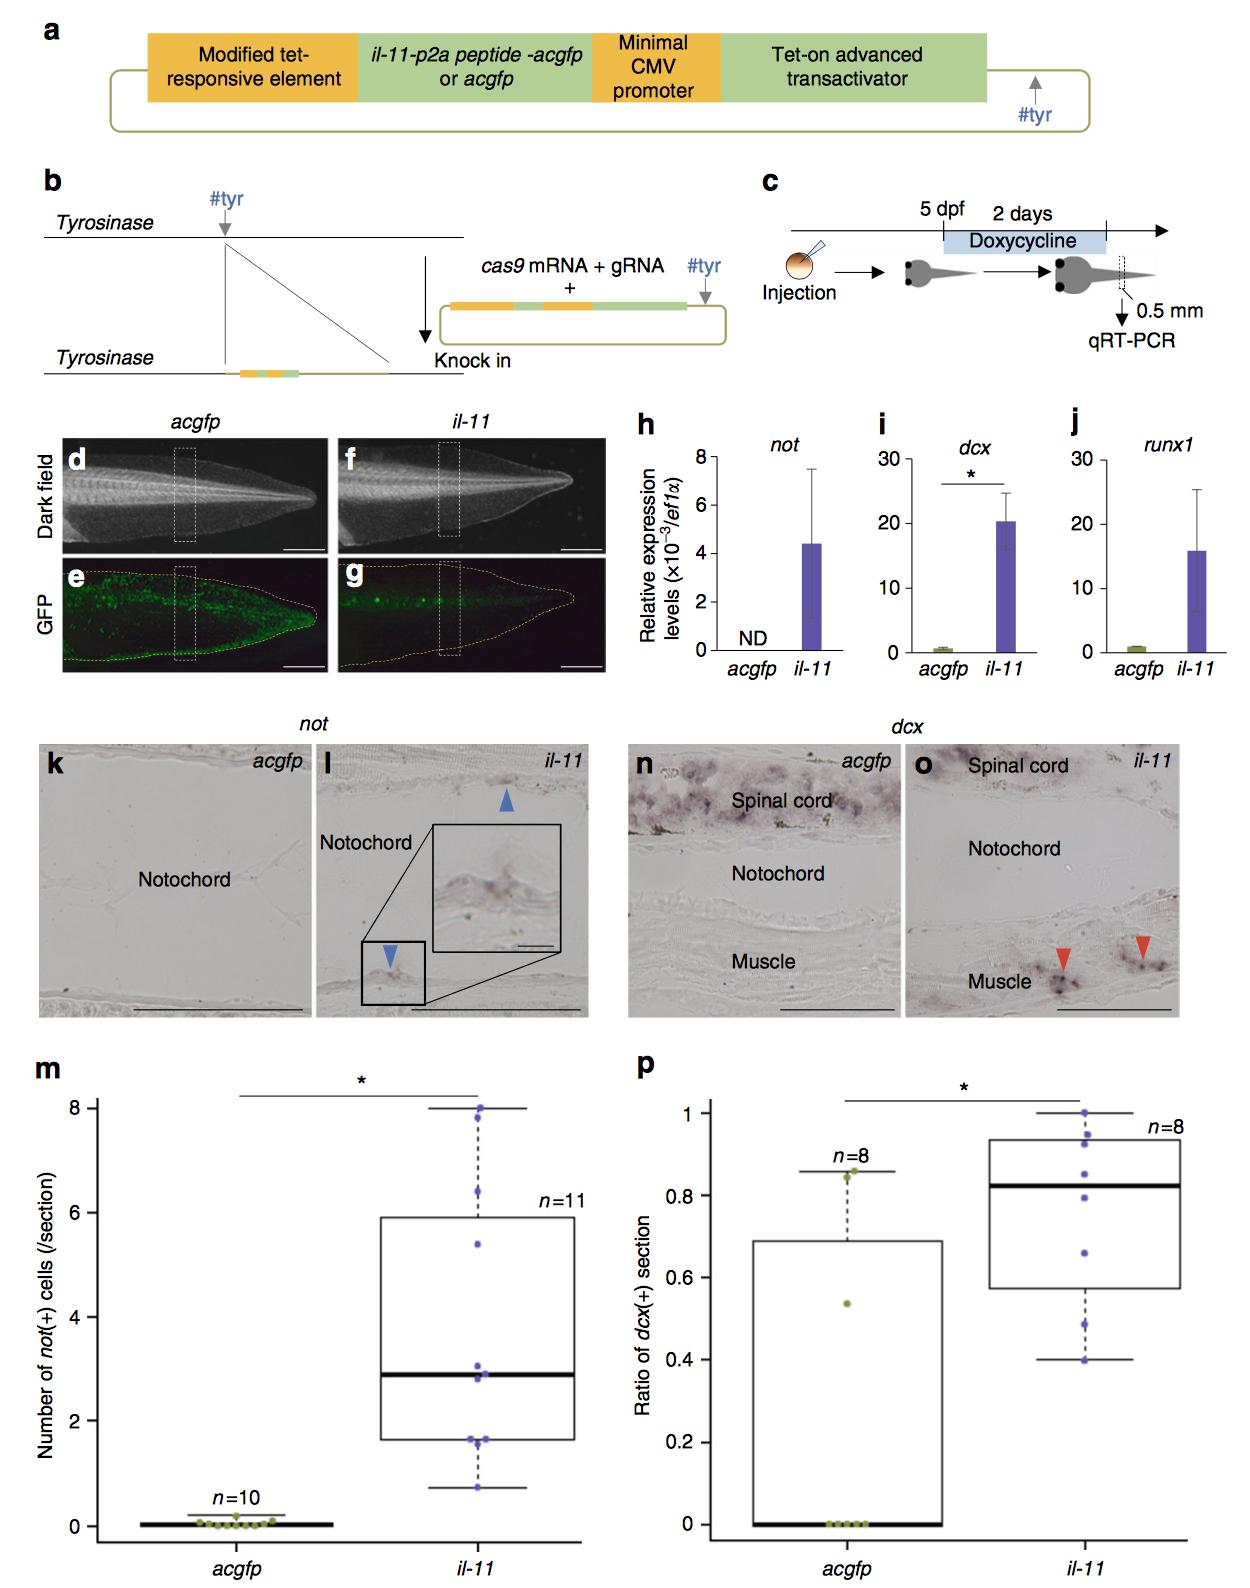
Fig. 6 il-11 is sufficient for induction of progenitor cells across cell lineages in intact tadpole tail. a Schematic drawing of a construct for forced expression of il-11. Yellow boxes represent cis-regulatory elements, and green boxes represent coding sequences. gRNA #tyr target site was inserted in the construct. In the control construct, acgfp was inserted instead of il-11-p2a peptide-acgfp. b Schematic drawing of knock-in. Dark grey arrows: gRNA #tyr target sequences. c Schematic drawing of a gain of function experiment. d–g, Representative images of tadpoles used in this experiment. acgfp-d, e or il-11-f, g expressing tails 2 days after doxycycline treatment are shown. Tail tissues indicated in white broken lines from approximately 10 tadpoles were used for qRT-PCR. Dark-field images d, f and GFP2-filtered images e, g are shown. Scale bars: 1 mm. Anterior is to the left, dorsal is up. Yellow broken lines indicate outline of the tails. h–j, Expression levels of not h, dcx i, or runx1 j in tails expressing acgfp or il-11 were measured by qRT-PCR. Vertical axes represent relative expression levels normalised by those of ef1α. Mean ± s.e.m. n = 3. k, l, n, o, Representative ISH images for not k, l or dcx n, o in acgfp k, n or il-11 l, o-expressing intact tadpole tails 2 days after doxycycline treatment are shown. Several not-expressing cells in the notochord sheath (blue arrowheads) and dcx-expressing muscle (red arrowheads) were detected in il-11−expressing tails. m The number of not-expressing cells in the notochord sheath in all sections containing notochord was counted. p The ratio of sections containing dcx-expressing muscle in all sections containing muscle was calculated. Box plots are inserted in the panels. Bars in the boxes represent median, upper and lower limits of the boxes represent the first and third quartiles, and whiskers represent maximum and minimum values. Scale bars: 100 μm except inset in (l) (10 μm). Anterior is to the left, dorsal is up. Magenta/purple colour represents signals for the genes. Inset: magnified view of boxed area. *P < 0.05, Student’s t-test. ND: not detected Image published in: Tsujioka H et al. (2017) © The Author(s) 2017. This image is reproduced with permission of the journal and the copyright holder. This is an open-access article distributed under the terms of the Creative Commons Attribution license Larger Image Printer Friendly View |