XB-IMG-159465
Xenbase Image ID: 159465
|
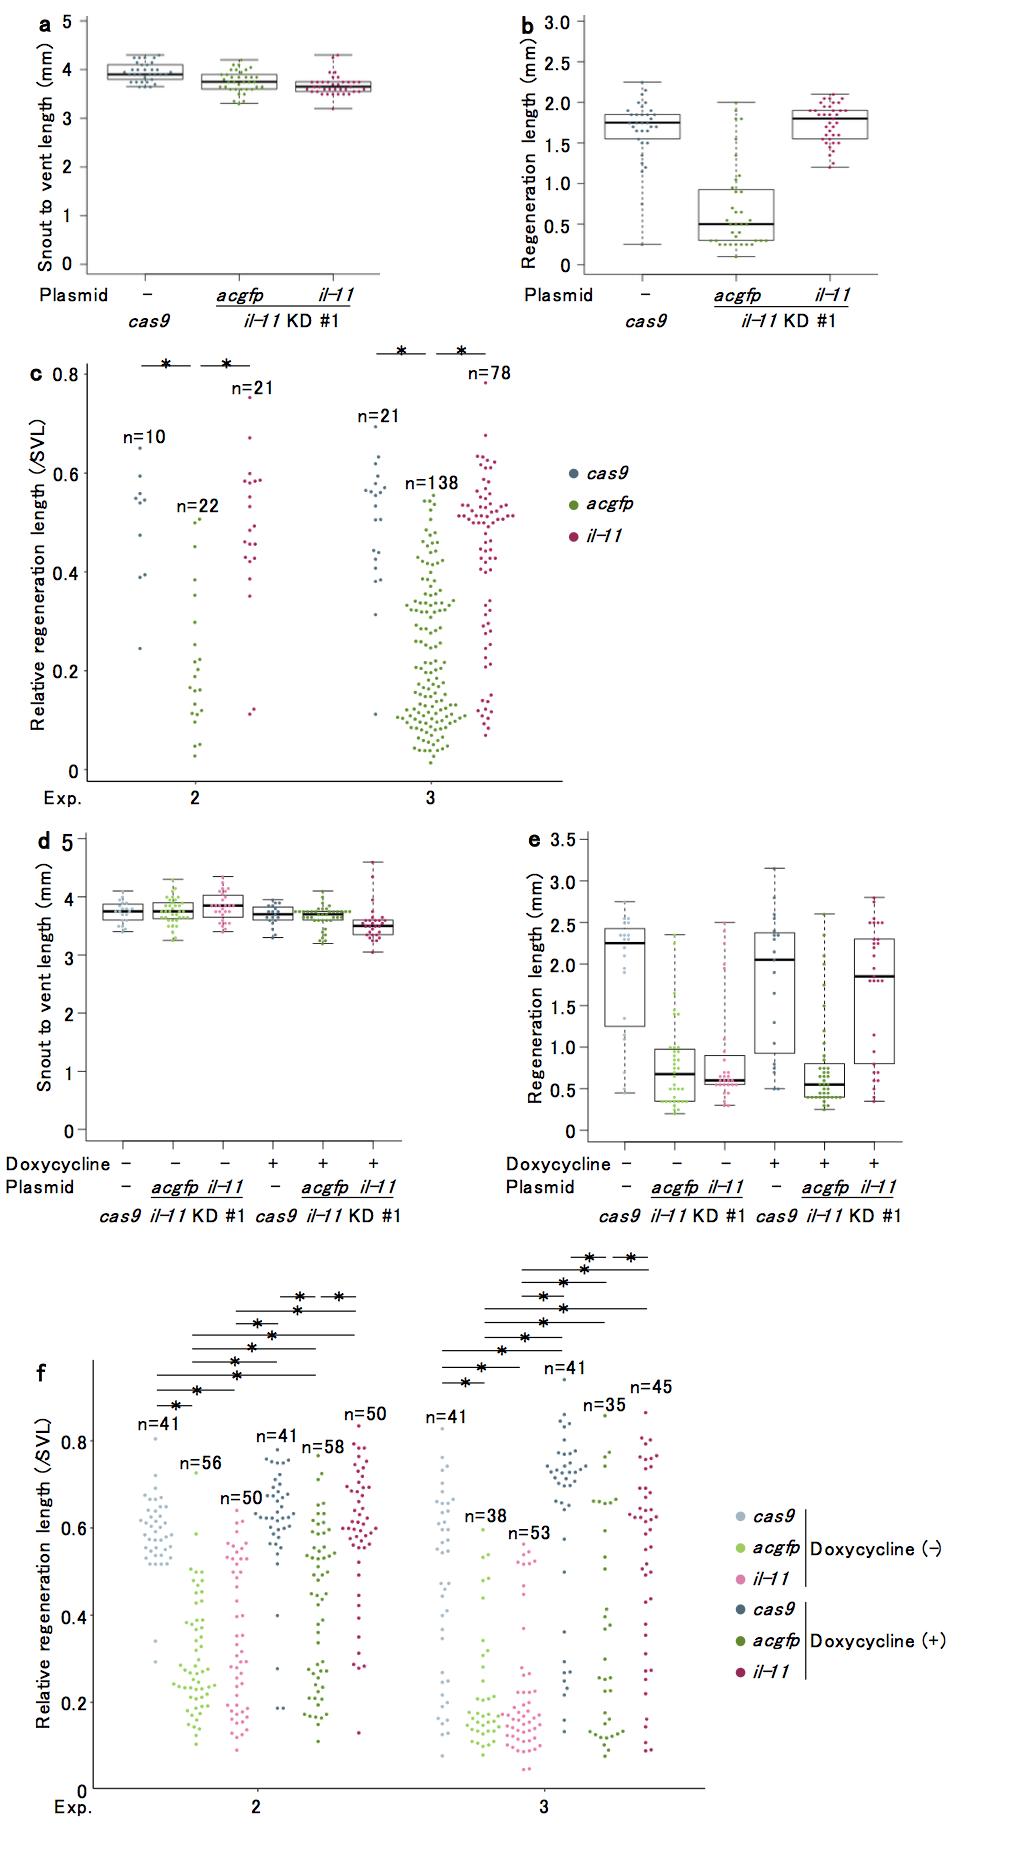
Supplementary Figure 5 Analyses of il-11 forced expressed il-11 knocked-down tadpoles.
a, b, d, e, Snout to vent length (SVL, a, d) and regeneration length (b, e) used for calculation in Fig. 3j (a, b) or Fig. 3x (d, e) are shown. c, f, Biological replicates for Fig. 3j (c) or Fig. 3x (f) using different batches of tadpoles are shown. Box plots are inserted in the panels. Bars in the boxes represent median, upper and lower limits of the boxes represent the first and third quartiles, and whiskers represent maximum and minimum values.*P < 0.05, Tukey-Kramer’s test. Image published in: Tsujioka H et al. (2017) © The Author(s) 2017. This image is reproduced with permission of the journal and the copyright holder. This is an open-access article distributed under the terms of the Creative Commons Attribution license Larger Image Printer Friendly View |