XB-IMG-169117
Xenbase Image ID: 169117
|
|
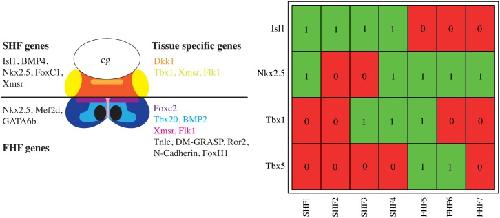
Fig 3. Schematic drawing of cardiac tissue in Xenopus laevis at stage 24—Expression of genes in heart fields (left) and RT–PCR analysis of selected genes (right).Panels adapted from Gessert and Kühl [19]. The left panel shows the genes expressed in different domains of the first heart field (FHF) and second heart field (SHF). The SHF is shown at the top and the FHF is shown at the bottom. Common genes expressed in all regions of the FHF and SHF, respectively, are shown on the left. Genes expressed in particular domains are shown on the right. Colors indicate different domains and corresponding expressed genes. The right figure shows the results of single cell RT–PCR analysis of gene expression for the four genes Nkx2.5, Isl1, Tbx1, and Tbx5. Values (0 and 1) and colors red/green represent inactive or active genes. The panel shows the gene expression of different single cell samples (numbered and named at the bottom). FHF and SHF are distinguished by the expression of the Isl1. Image published in: Grieb M et al. (2015) Image reproduced on Xenbase with permission of the publisher and the copyright holder. This image is reproduced with permission of the journal and the copyright holder. This is an open-access article distributed under the terms of the Creative Commons Attribution license Larger Image Printer Friendly View |