XB-IMG-169373
Xenbase Image ID: 169373
|
|
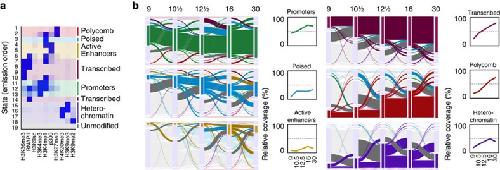
Figure 2. Chromatin state dynamics.(a) Emission states (same for all developmental stages) of the hidden Markov model, identifying the 19 most prevalent combinations of histone modifications and bound proteins. From top to bottom: Polycomb (red), Poised enhancers and promoters (blue), Active Enhancers (gold), Transcribed (dark magenta), Promoter (green), Heterochromatin (purple) and unmodified (grey). (b) Alluvial plots of chromatin state coverage during development. Each plot shows the transitions (to and from the highlighted group of chromatin states) across developmental stages (stages 9–30). The height represents the base pair coverage of the chromatin state relative to the modified genome. The ‘modified genome' has a chromatin state other than unmodified in any of the stages 9–30. From top to bottom left: promoters (green), poised (blue), p300-bound enhancers (gold). From top to bottom right: transcribed (dark magenta), Polycomb (red) and heterochromatin (purple). Line plots: Chromatin state coverage per stage as a percentage of the modified genome. Image published in: Hontelez S et al. (2015) Copyright © 2015, Nature Publishing Group, a division of Macmillan Publishers Limited. This image is reproduced with permission of the journal and the copyright holder. This is an open-access article distributed under the terms of the Creative Commons Attribution license Larger Image Printer Friendly View |