XB-IMG-170144
Xenbase Image ID: 170144
|
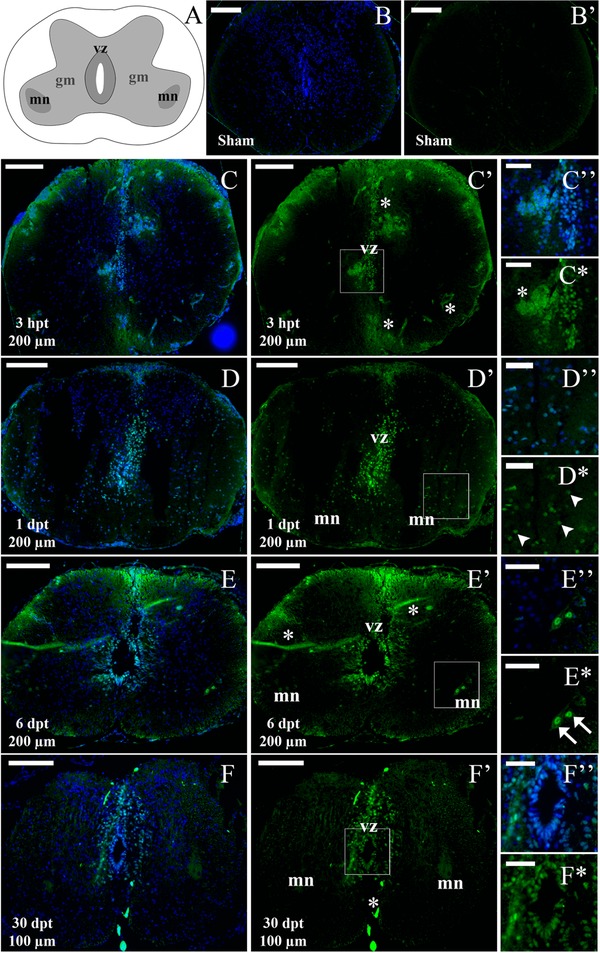
Figure 6. Immunofluorescence analysis of pSTAT3 levels in NR66 stage animals after SCI. (A) Scheme representing a coronal section from an NR66 stage spinal cord: Vz, ventricular zone; Mn, motor neuron columns; Gm, remaining grey matter. (B)−(F*) Coronal sections through the spinal cord, analyzed for immunostaining for pSTAT3 (green) and TOTO3 staining (nuclei, blue). (B), (B′) Section from a sham operated animal at 1 dpt. (C), (C*) Section from a transected animal at 3 hpt and 200 μm caudal to the lesion; boxed area indicates a digital zoom of the ventricular zone (vz) and auto‐fluorescent clot (asterisk). (D), (E*) Section at 1 dpt (D), (D*) and 6 dpt (E), (E*) 200 μm caudal to the lesion; boxed areas indicate digital zooms of grey matter and motoneuron columns. Arrows indicate representative pSTAT3+ motoneurons (white arrows, cells with large nuclei) and cells in the grey matter (white arrowheads). (F), (F*) Section at 30 dpt and 100 μm caudal to the lesion; boxed area indicates a digital zoom of the ventricular zone. White bars indicate 100 μm (B), (C′), (D), (D′), (E), (E′), (F), (F′) and 30 μm (C′), (C*), (D′), (D*), (E′), (E*), (F′), (F*). The sections depicted are representative of three animals for 3 hpt to 6 dpt and two animals for 30 hpt. Image published in: Tapia VS et al. (2017) © 2017 The Authors. This image is reproduced with permission of the journal and the copyright holder. This is an open-access article distributed under the terms of the Creative Commons Attribution license
Image source: Published Larger Image Printer Friendly View |