XB-IMG-170145
Xenbase Image ID: 170145
|
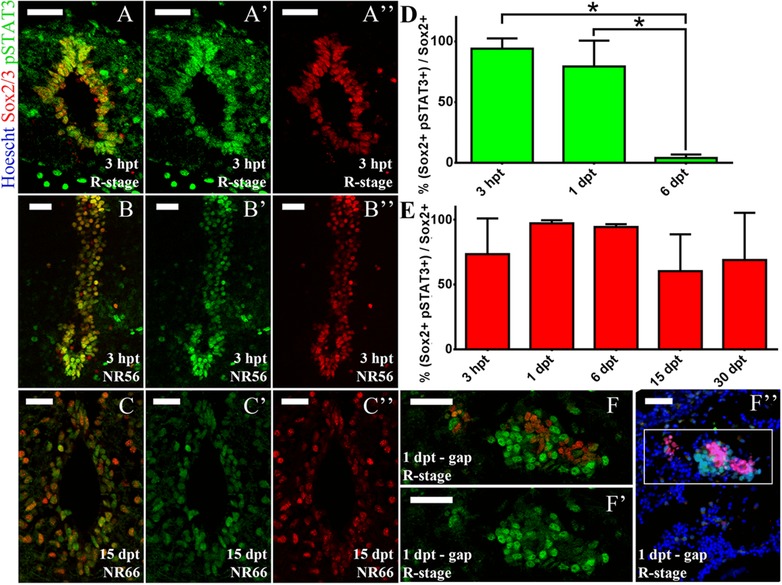
Figure 7. JAK‐STAT pathway activation in Sox2/3+ cells. Coronal sections through the spinal cord and injury site of R, NR56 and NR66 animals, analyzed for pSTAT3 (green), Sox2 (red) and Hoechst (nuclei, blue). (A)−(B′) Sections from R stage (A)−(A′) and NR56 stage (B)−(B′) animals at 3 hpt showing the ventricular zone at 300 μm caudal to the lesion site. (C)−(C′) Section from an NR66 stage animal at 15 dpt showing the ventricular zone at 100 μm caudal to the lesion site. The sections depicted are representative of two to three animals. (D), (E) Quantification of ventricular pSTAT3+ Sox2+ cells in one section per animal was performed for (D) R and (E) NR66 stages. Difference between time 012457+\9points was assessed by multiple comparisons with a one‐way ANOVA test (*P < 0.1). (F)−(F’’) Section from an R stage animal at 1 dpt showing the lesion site (ablation gap); representative of three animals. (F), (F′) An optical zoom of (F′). White bars indicate 30 μm. Image published in: Tapia VS et al. (2017) © 2017 The Authors. This image is reproduced with permission of the journal and the copyright holder. This is an open-access article distributed under the terms of the Creative Commons Attribution license
Image source: Published Larger Image Printer Friendly View |